Errors
The Numaflow UI provides an Errors Tab that lists the recent errors (up to 10 per container) that may have occurred in the user-defined function (UDF) code. This feature helps users quickly identify and debug application errors.
In this guide, we will simulate a panic in a transformer and demonstrate how the errors are displayed in the Errors Tab for a monovertex.
Note: The Errors Tab and its related functionality are currently available only for MonoVertex. Support for Pipelines is planned for future releases.
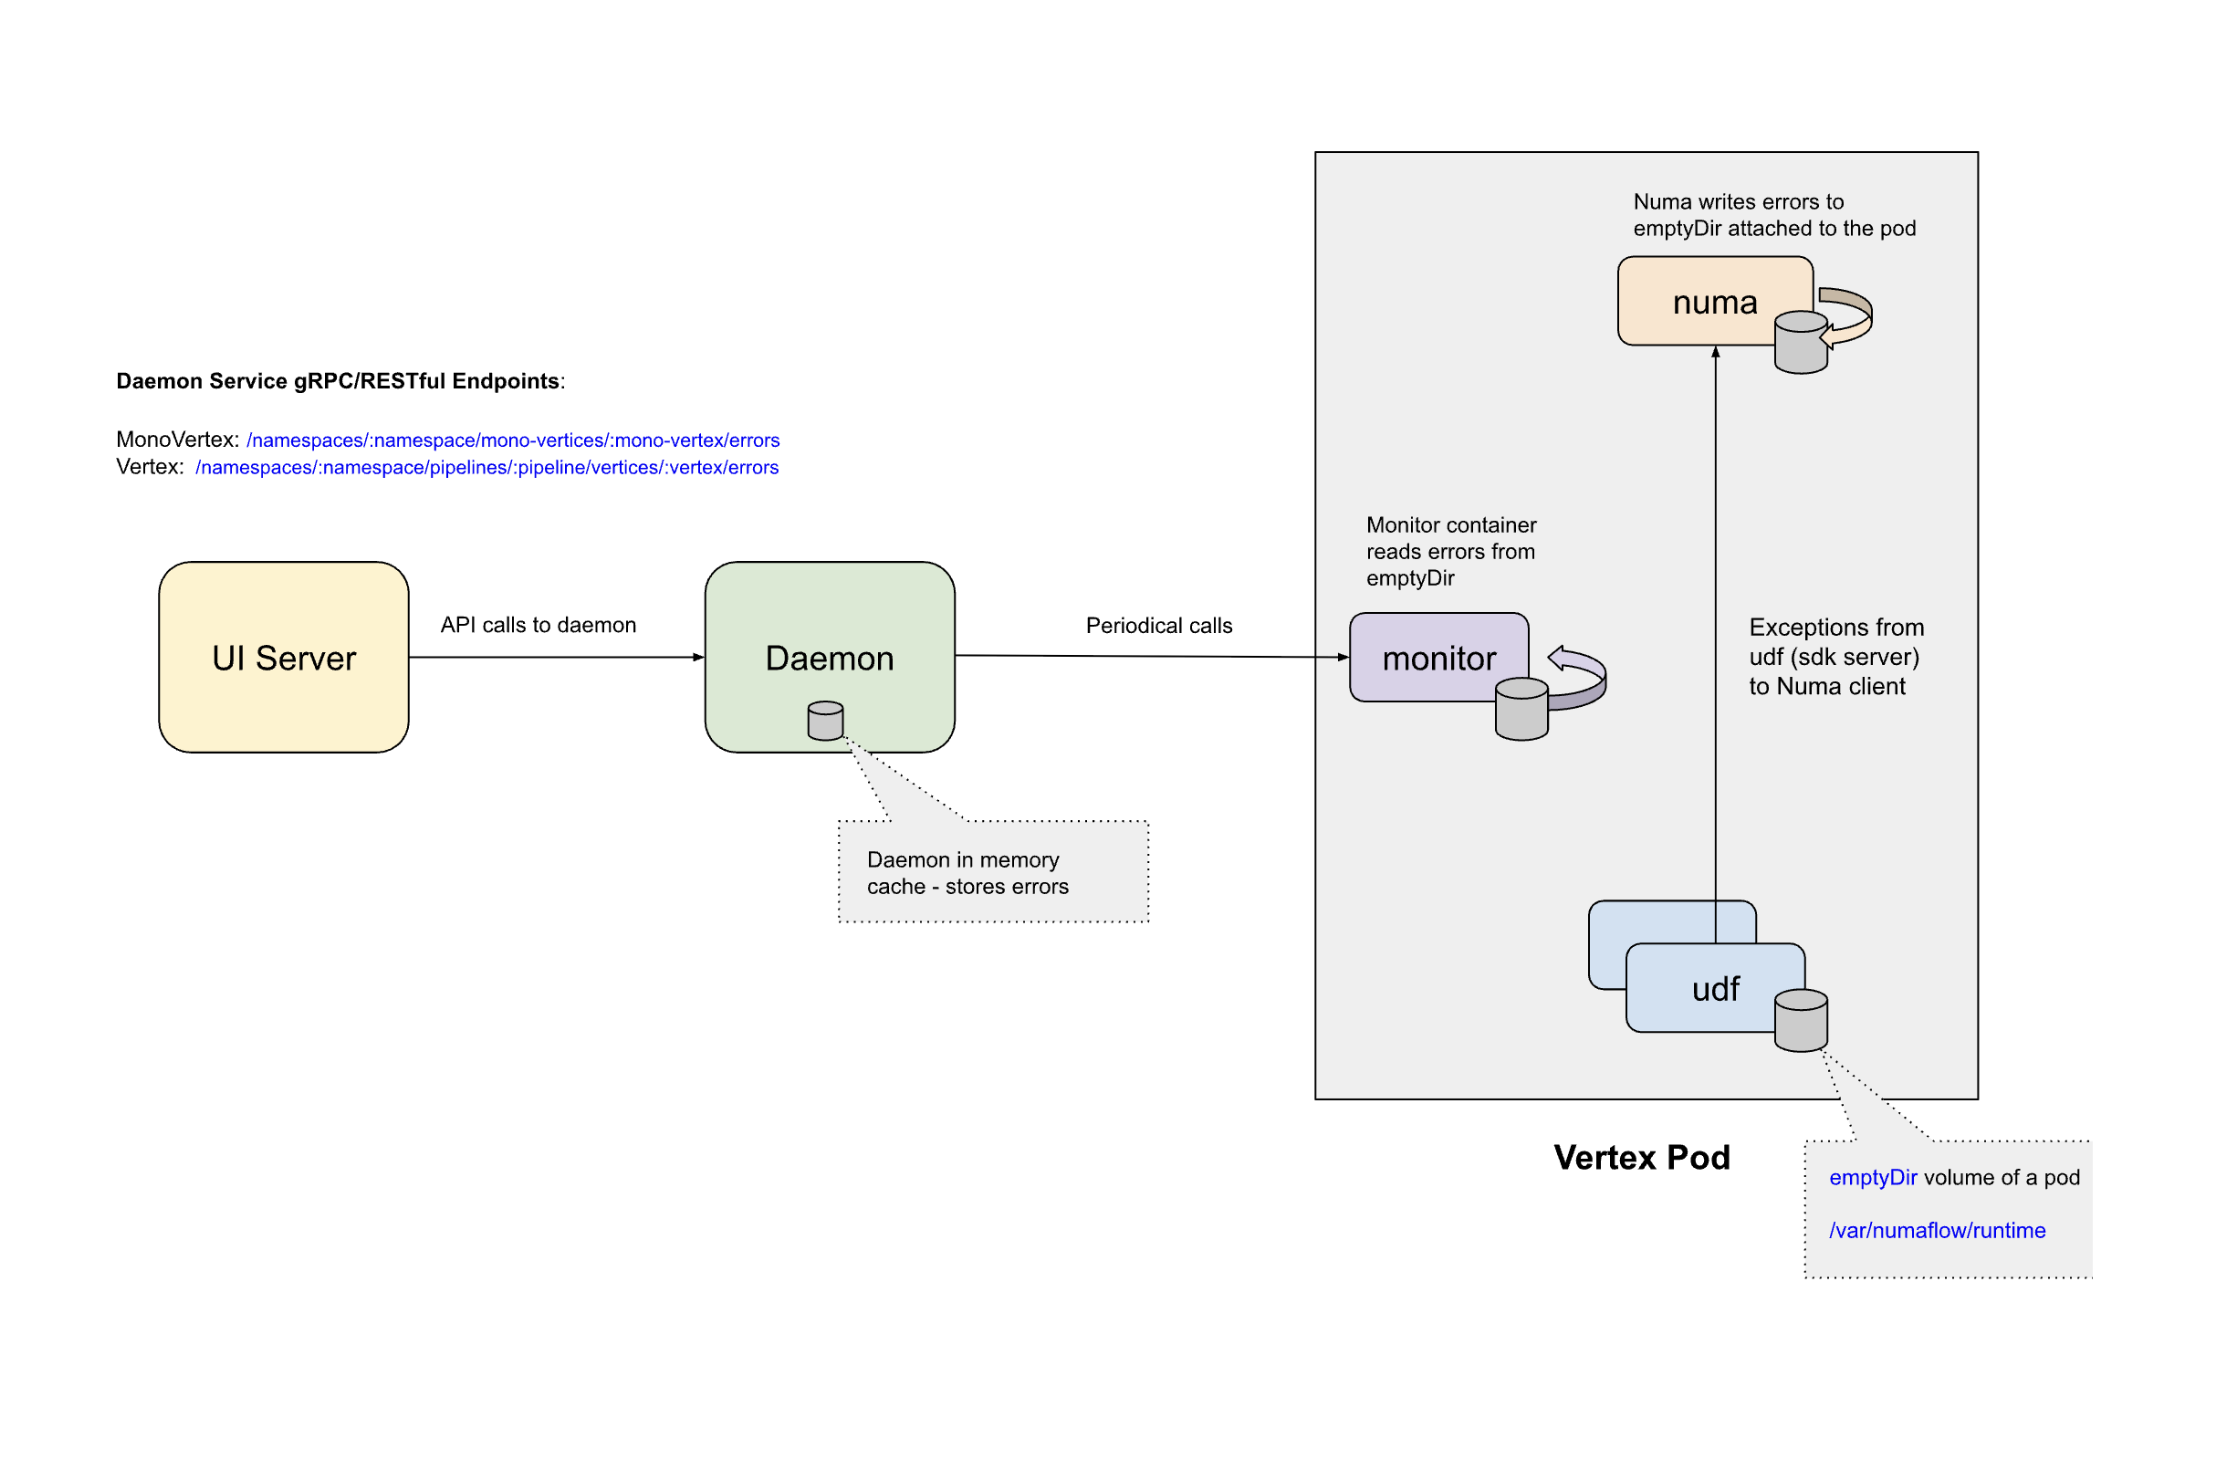
High-Level Architecture
Simulating an Error in the Transformer
To simulate an error, we will introduce a panic in the Go SDK for the transformer by modifying the Transform function. You can find the relevant code here.
Below is the modified code snippet:
// AssignEventTime is a source transformer that assigns event time to the message.
type AssignEventTime struct {
    counter uint64
}

func (a *AssignEventTime) Transform(ctx context.Context, keys []string, d sourcetransformer.Datum) sourcetransformer.Messages {
    newCount := atomic.AddUint64(&a.counter, 1)
    // Trigger a panic if the counter is a multiple of 5
    if newCount%5 == 0 {
        panic("Counter reached a multiple of 5")
    }
    // Update the message's event time to the current time
    eventTime := time.Now()
    // Log the action for testing purposes
    log.Printf("AssignEventTime: Assigning event time %v to message %s", eventTime, string(d.Value()))
    return sourcetransformer.MessagesBuilder().Append(sourcetransformer.NewMessage(d.Value(), eventTime).WithKeys(keys))
}
In this example, the code triggers a panic whenever the counter reaches a multiple of 5. This simulates an error scenario that will be captured and displayed in the Errors Tab.
The UI Errors Tab
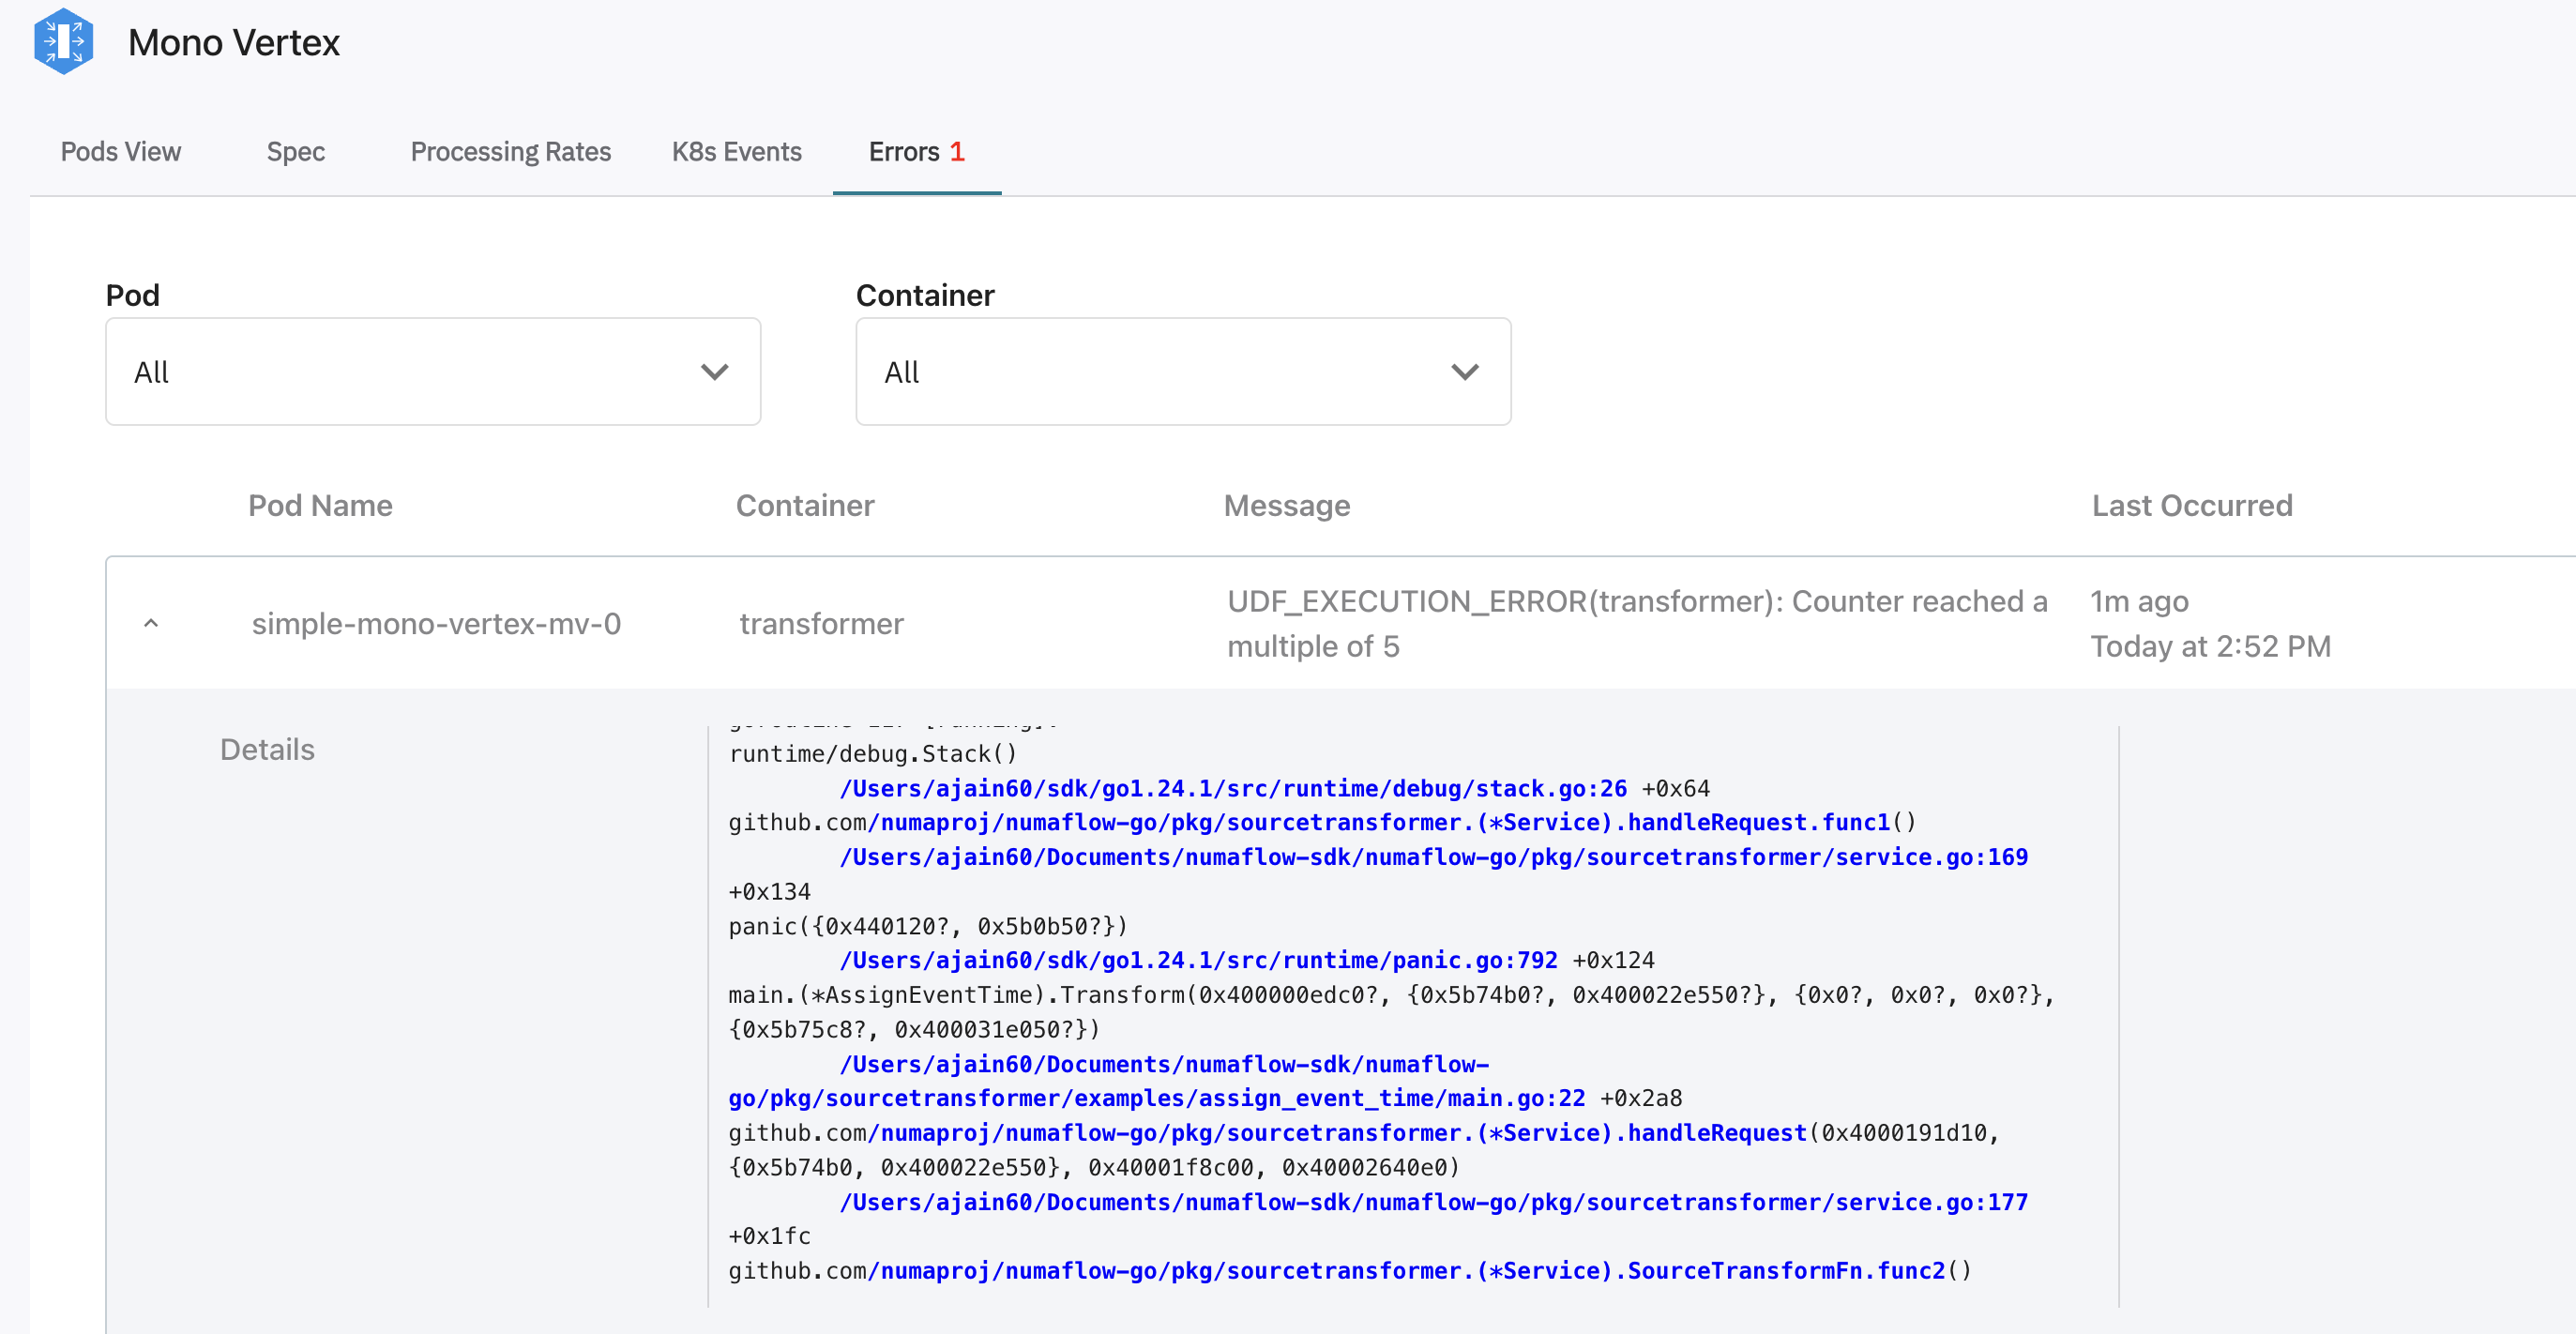
The Errors Tab provides the following features:
- Error Count: Displays the total number of errors across all pods and containers at the top level.
- Pod and Container Filters: Allows users to filter errors by selecting a specific pod or container for more focused debugging.
-
Tabulated Errors: Errors are displayed in a tabular format with the following columns:
Pod NameContainerMessageLast Occurred
-
Details: Expanding an error entry reveals a
Detailssection that includes the stack trace of the error, providing deeper insights for debugging.
Types of Errors Displayed in the Errors Tab
The Errors Tab in the Numaflow UI captures and displays various types of errors that may occur during the execution of user-defined functions (UDFs). Below are the common categories of errors you can expect:
1. Exceptions in User Code
Any exception that occurs within the user-defined function (UDF) code will be captured and displayed in the Errors Tab. These errors typically indicate issues in the logic or implementation of the UDF.
2. Partial Responses
Errors may occur when the user code sends partial or incorrect responses. For example:
- Returning
nullinstead ofMessage.toDropin a UDSink when a message needs to be dropped.
3. Critical Errors Persisted by the User
Users can invoke the PersistCriticalError utility function to log critical errors in the emptyDir volume. This is useful for capturing severe issues that require immediate attention. Below are links to the implementations in different SDKs: