Grafana
Numaflow provides prometheus metrics on top of which you can build Grafana dashboard to monitor your pipeline.
Setup Grafana
- (Pre-requisite) Follow Metrics to set up prometheus operator.
- Follow Prometheus Tutorial to install Grafana and visualize metrics.
Sample Dashboard
You can customize your own dashboard by selecting metrics that best describe the health of your pipeline. Below is a sample dashboard which includes some basic metrics.
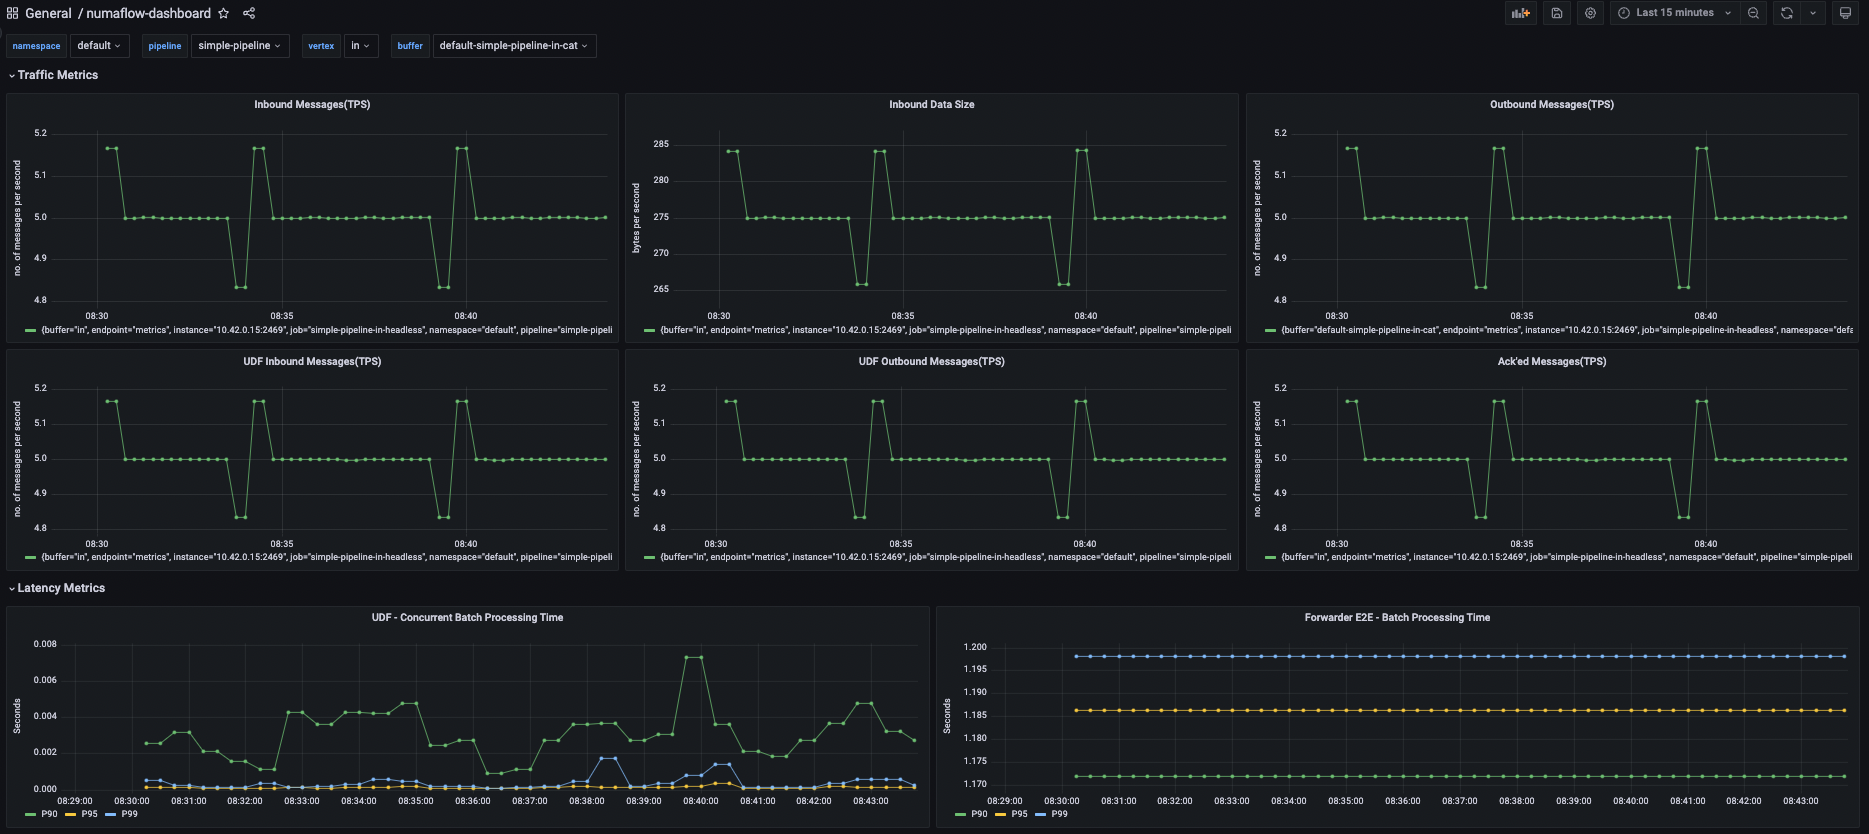
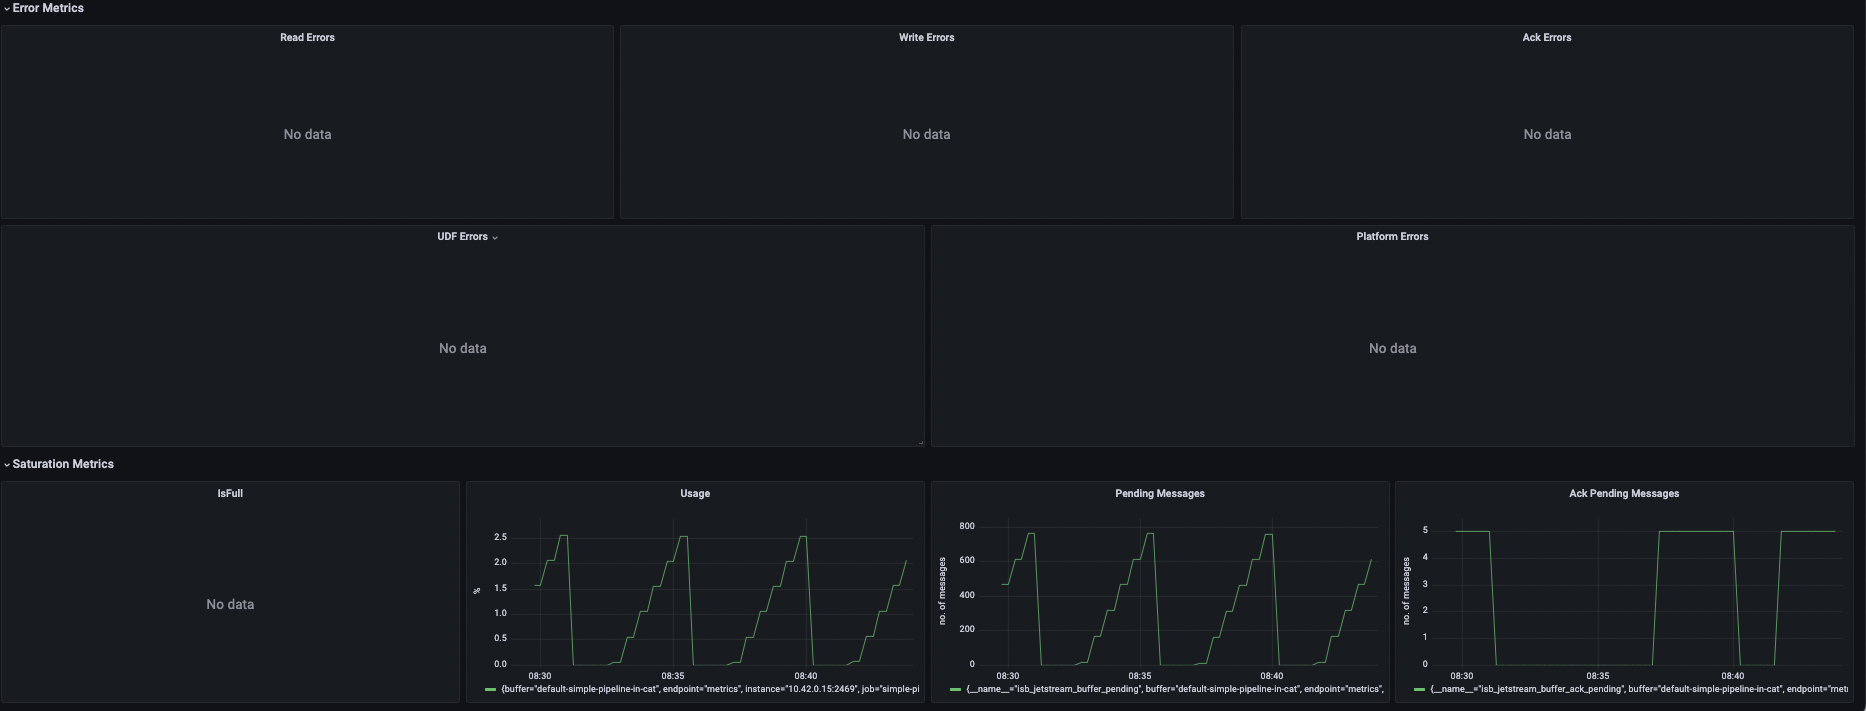
To use the sample dashboard, download the corresponding sample dashboard template, import(before importing change the uid of the datasource in json, issue link) it to Grafana and use the dropdown menu at top-left of the dashboard to choose which pipeline/vertex/buffer metrics to display.