Numaflow UI Overview
Numaflow provides a built-in user interface (UI) for monitoring and managing your data pipelines.
Accessing the Numaflow UI
To access the Numaflow UI, use the following command to port-forward the Numaflow server:
kubectl -n numaflow-system port-forward deployment/numaflow-server 8443:8443
Once port-forwarding is active, open your browser and navigate to https://localhost:8443.
UI Views
We have already walked through some of the views of UI to monitor pipelines in the Quick Start guide.
- Cluster View
- Namespace View
- Simple Pipeline View
Vertex View
Vertex View provides detailed insights into each pipeline vertex. The following features are available:
Pods View
Inspect the status and details of pods running in your pipelines.
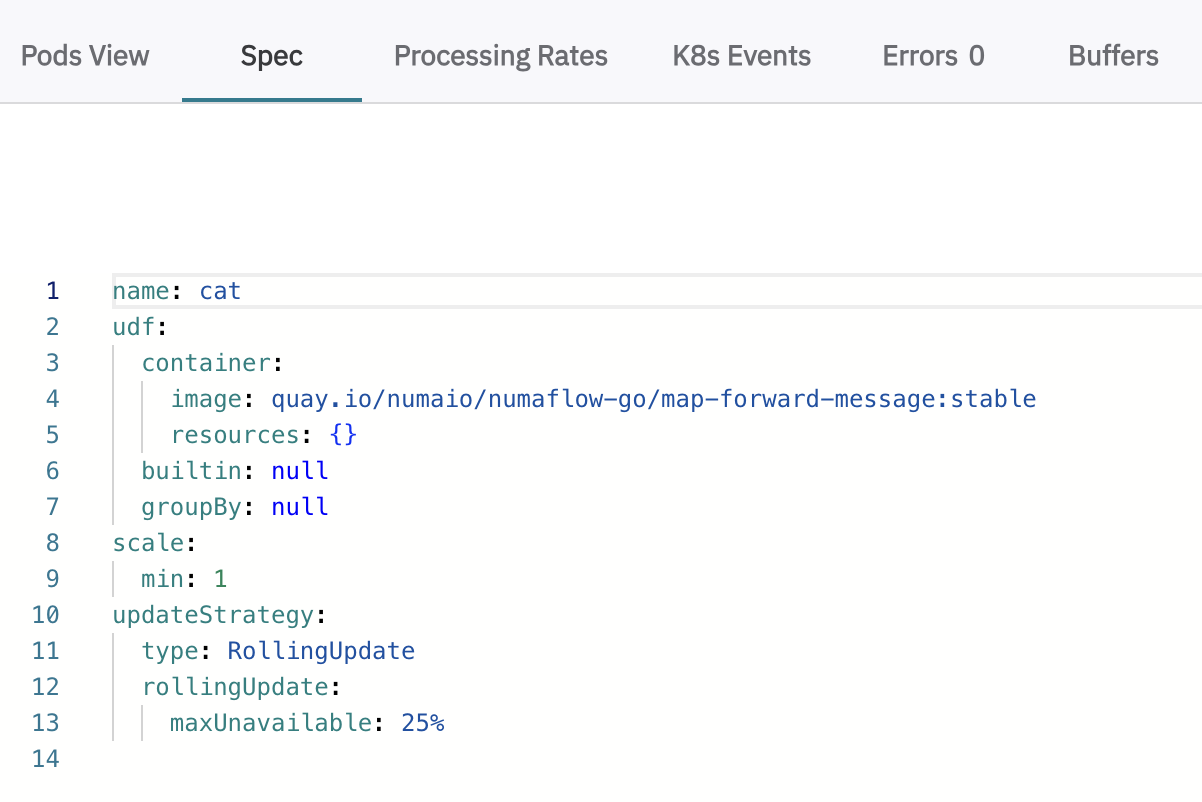
Spec
View the specification of the vertex.
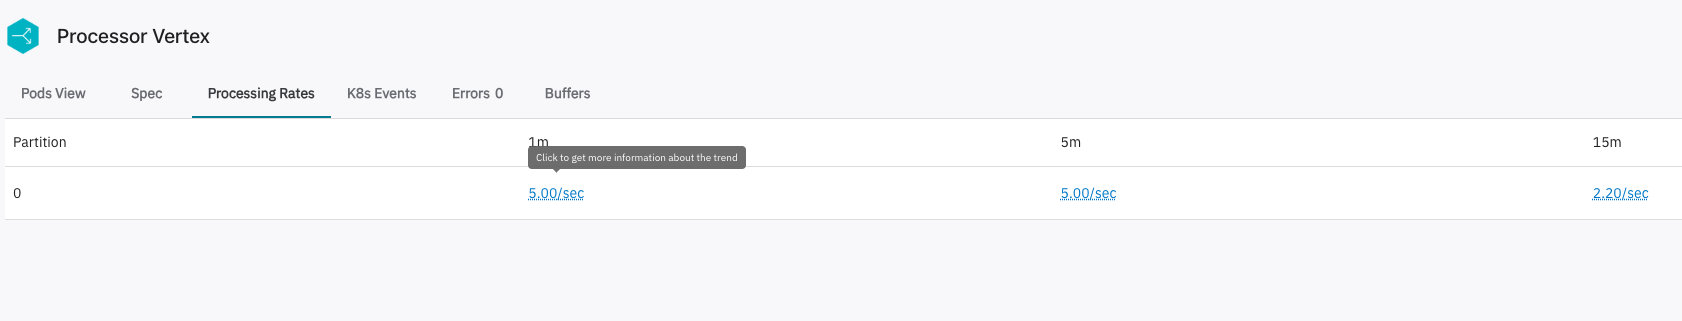
Processing Rates
See the last 1m, 5m, and 15m processing rates for each partition of the vertex.
If a Prometheus server is configured, you can click on the number to see more details in the Metrics tab.
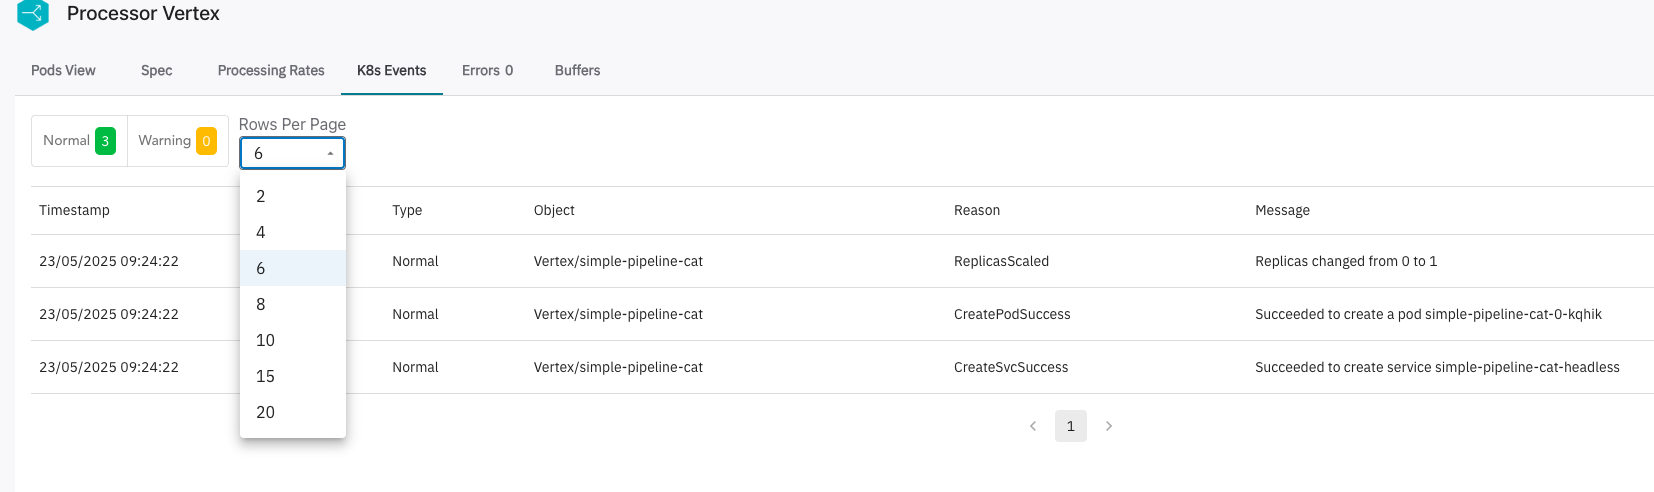
Kubernetes Events
View Kubernetes events related to the vertex.
Errors
Review errors detected in your pipelines for quick debugging.
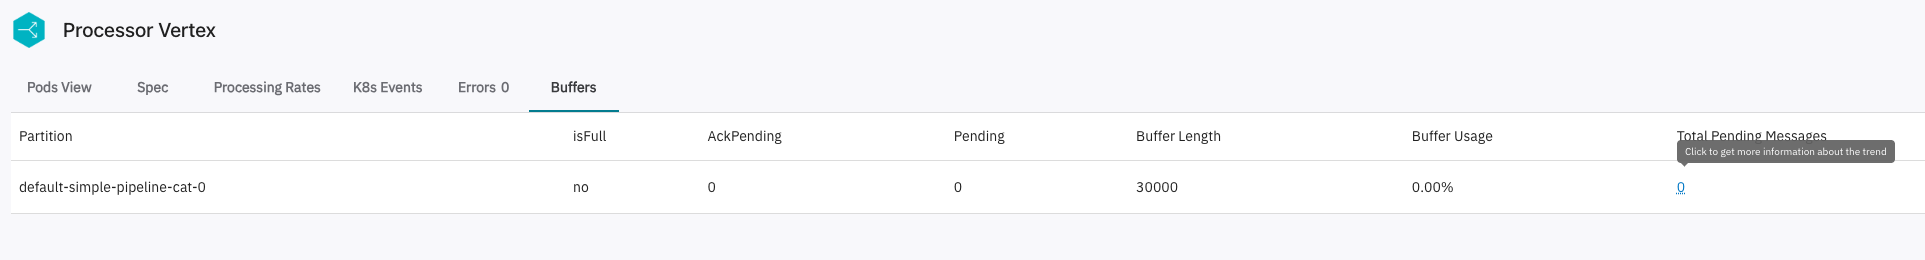
Buffers
See buffer details for every partition, including buffer length, usage, and number of pending messages. Click on the pending number to view complete pending metrics in the Metrics tab.
Logs
View logs for different containers of pods to help diagnose issues.
Metrics
Monitor pipeline metrics for performance.