Logs View
The Logs View lets you inspect container logs for a vertex pod directly in the Pods View. After you select a pod and container, the Container Logs panel on the right shows logs from that container.
Navigating to Container Logs
Navigate to the Pods View tab after selecting the vertex.
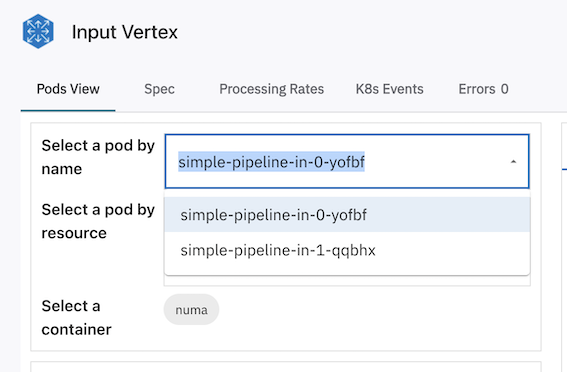
Select a Pod
Select a pod by name from the Select a pod by name dropdown, or select a pod by resource using the CPU/Memory heat map.
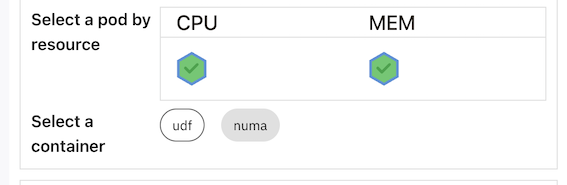
Select a Container
Choose a container from the Select a container section.
View Logs
The Container Logs panel appears on the right. The header shows the title Container Logs and a badge with the short pod/container name (for example, out-0/numa). Hover the badge to see the full pod and container name.
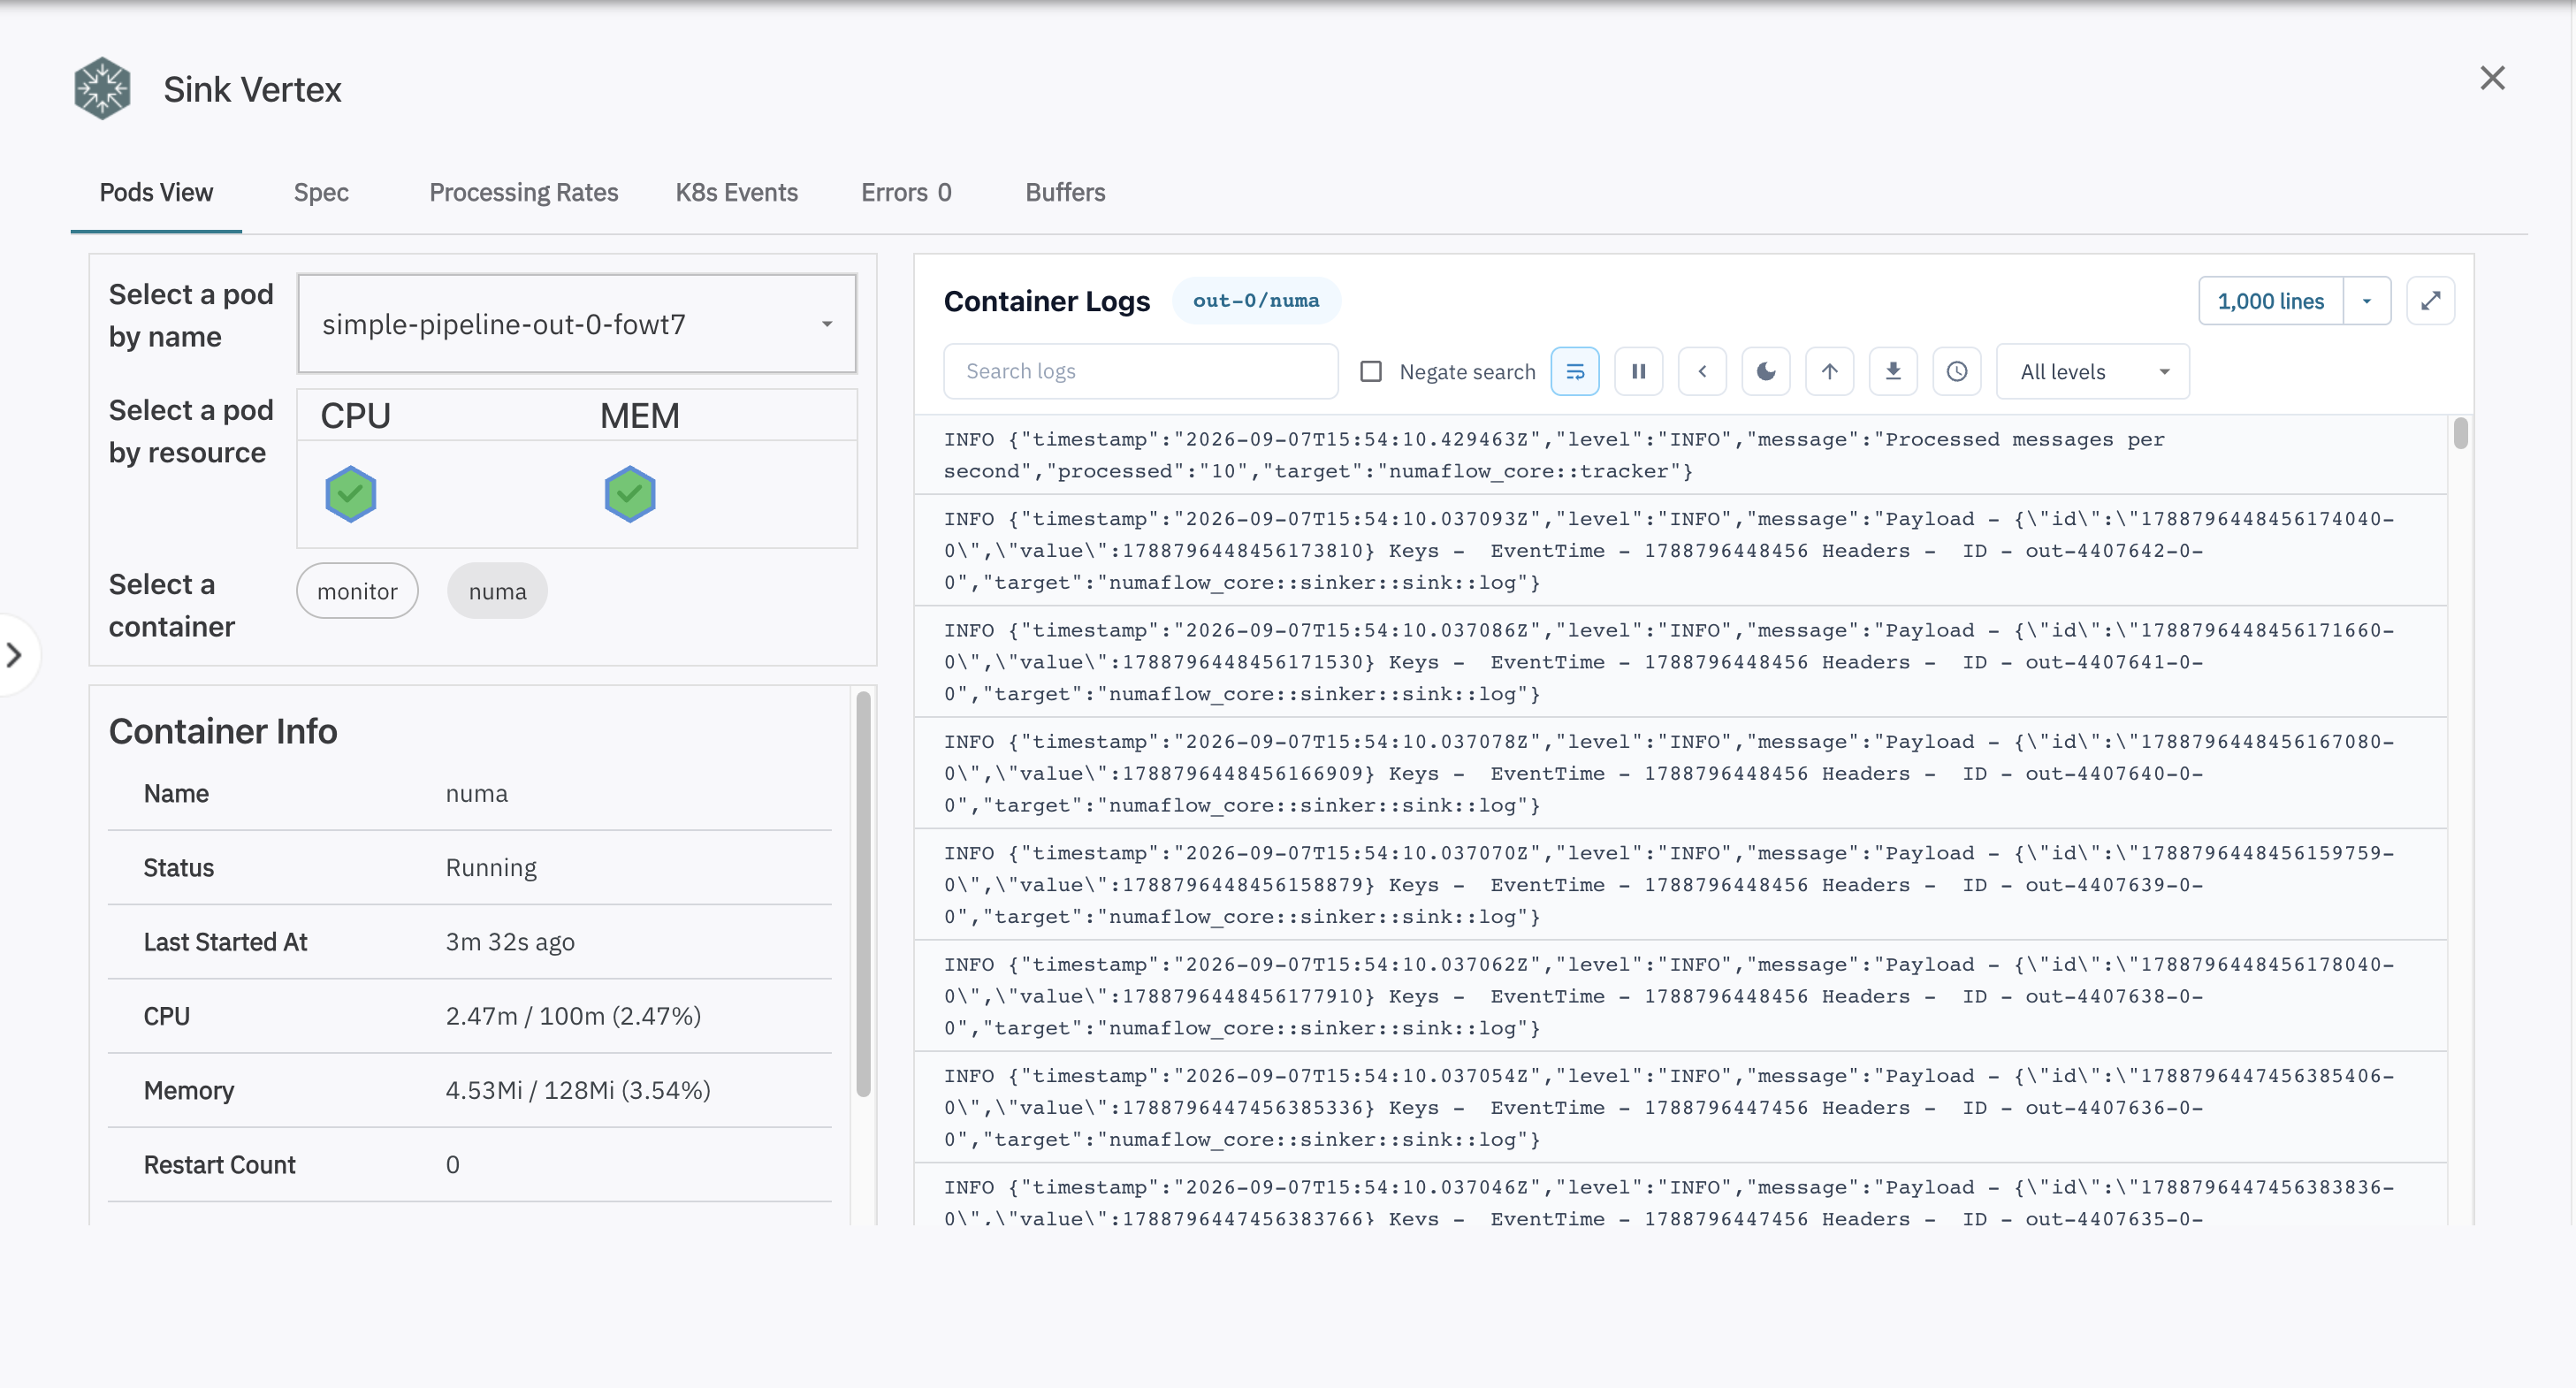
While logs are shown, you can still use the left sidebar to review Container Info and Pod Info (status, CPU, memory, restart count, and related details).
Toolbar overview
The logs toolbar is grouped into:
- Header (top row): title, source badge, optional status banner, tail/window size, and focus (expand) control.
- Controls (second row): search, match navigation, negate search, wrap, pause, previous container, theme, sort order, download, timestamps, and level filter.
Status banners appear in the header when applicable:
- Logs paused — new log lines are not being added.
- Previous container — you are viewing logs from the previous terminated container instance.
Features
1. Log window size (tail lines)
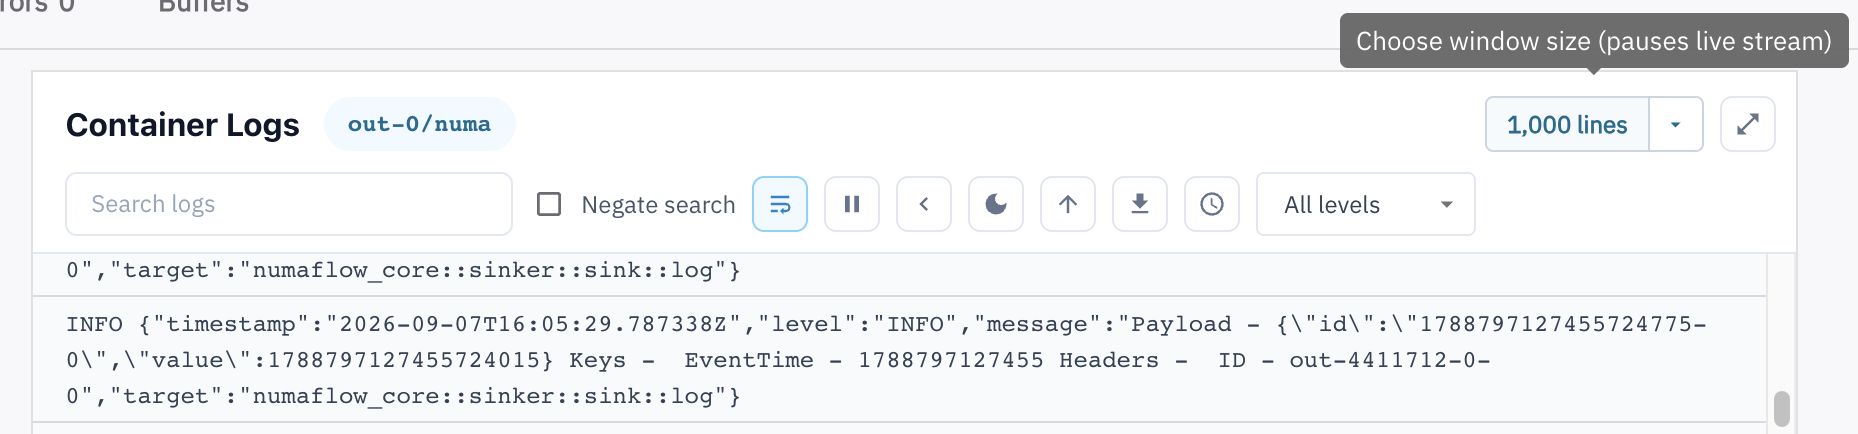
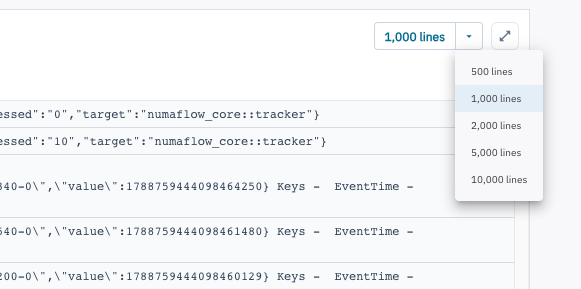
Use the N lines dropdown in the top-right (default: 1,000 lines) to choose how many recent log lines to show:
- 500 lines
- 1,000 lines
- 2,000 lines
- 5,000 lines
- 10,000 lines
While logs are updating live, changing the window size pauses updates and shows that many recent lines. A Logs paused banner appears until you resume.
2. Focus view (expanded logs)
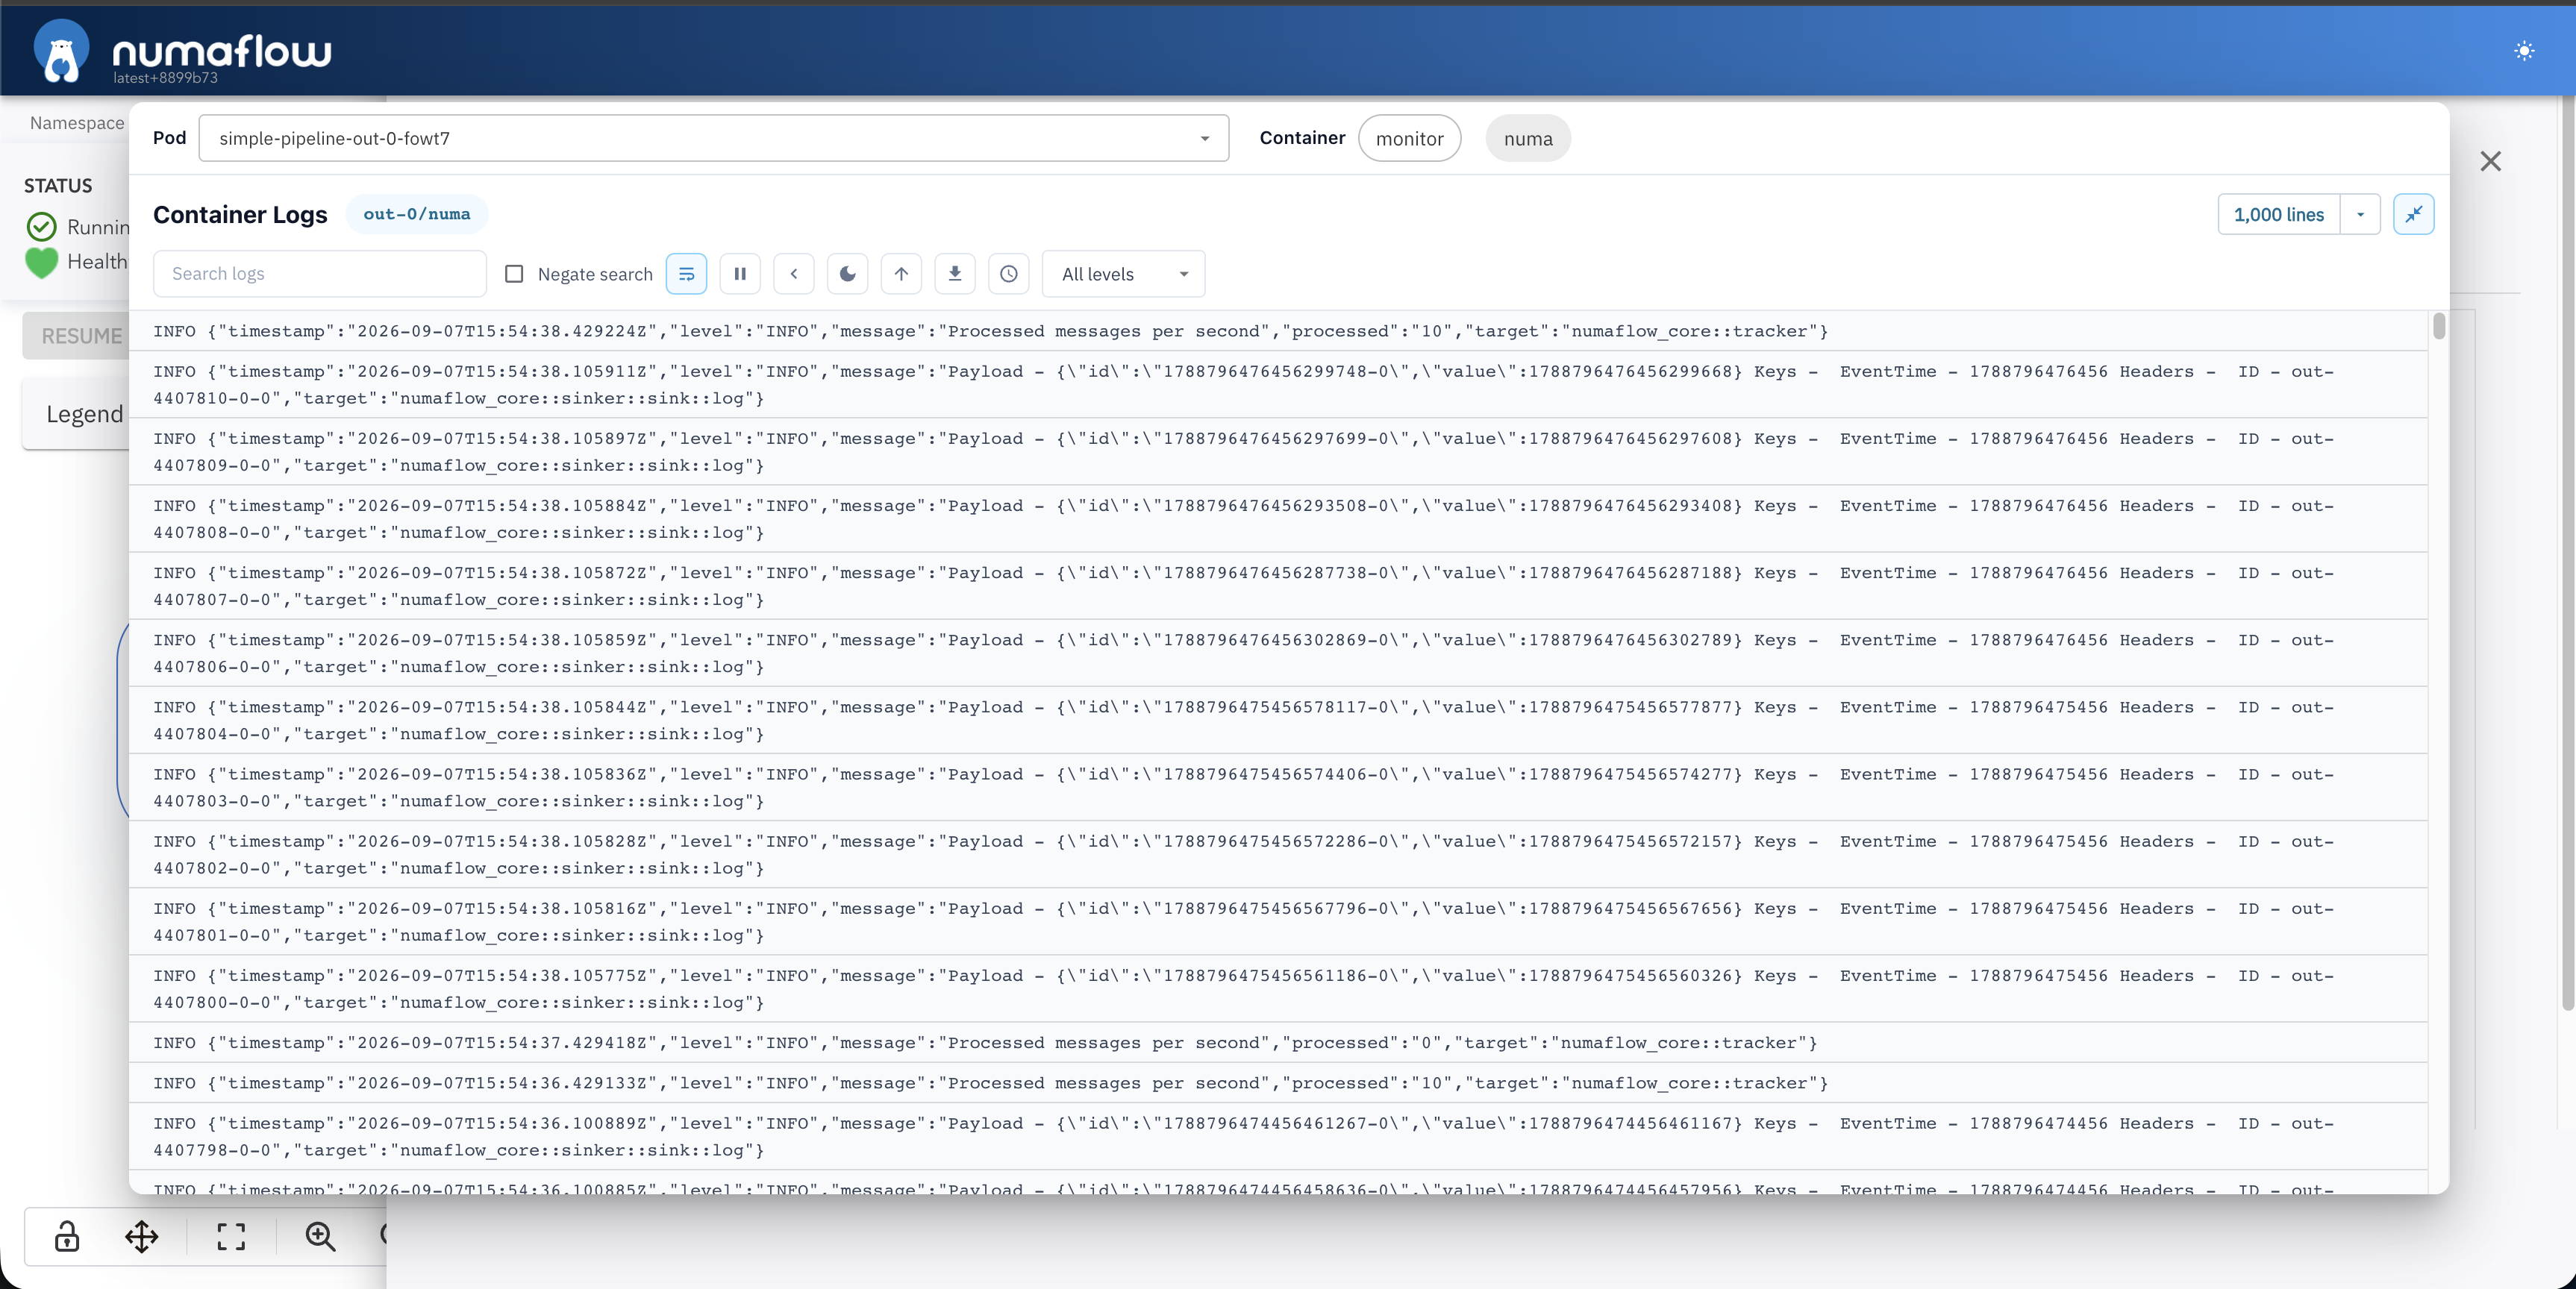
Click the expand icon in the header to open a larger focused log view. In focus mode:
- Pod and Container selectors appear at the top of the dialog so you can switch context without closing focus mode.
- All log toolbar controls remain available.
While focus mode is open, the inline panel shows Logs are open in the focused view.
Click Exit focus (or the collapse icon) to return to the inline panel.
3. Search logs
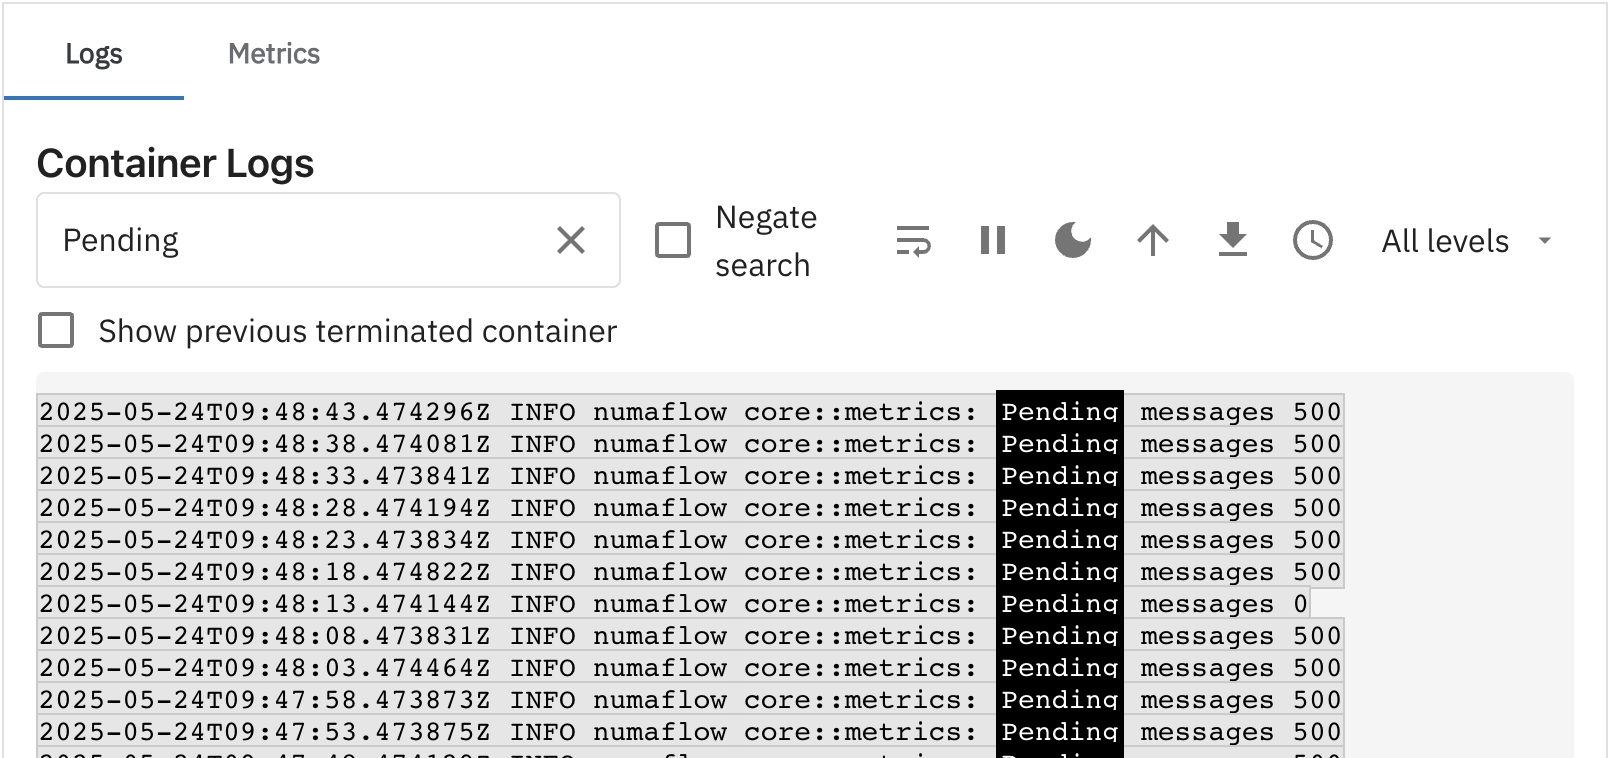
Type keywords in Search logs to filter the lines currently shown. Matching text is highlighted. When matches exist, a counter (for example, 1 / 3) appears with previous and next controls.
Keyboard shortcuts:
Enter— next matchShift+Enter— previous match
Use the clear (×) control to reset the search.
4. Negate search
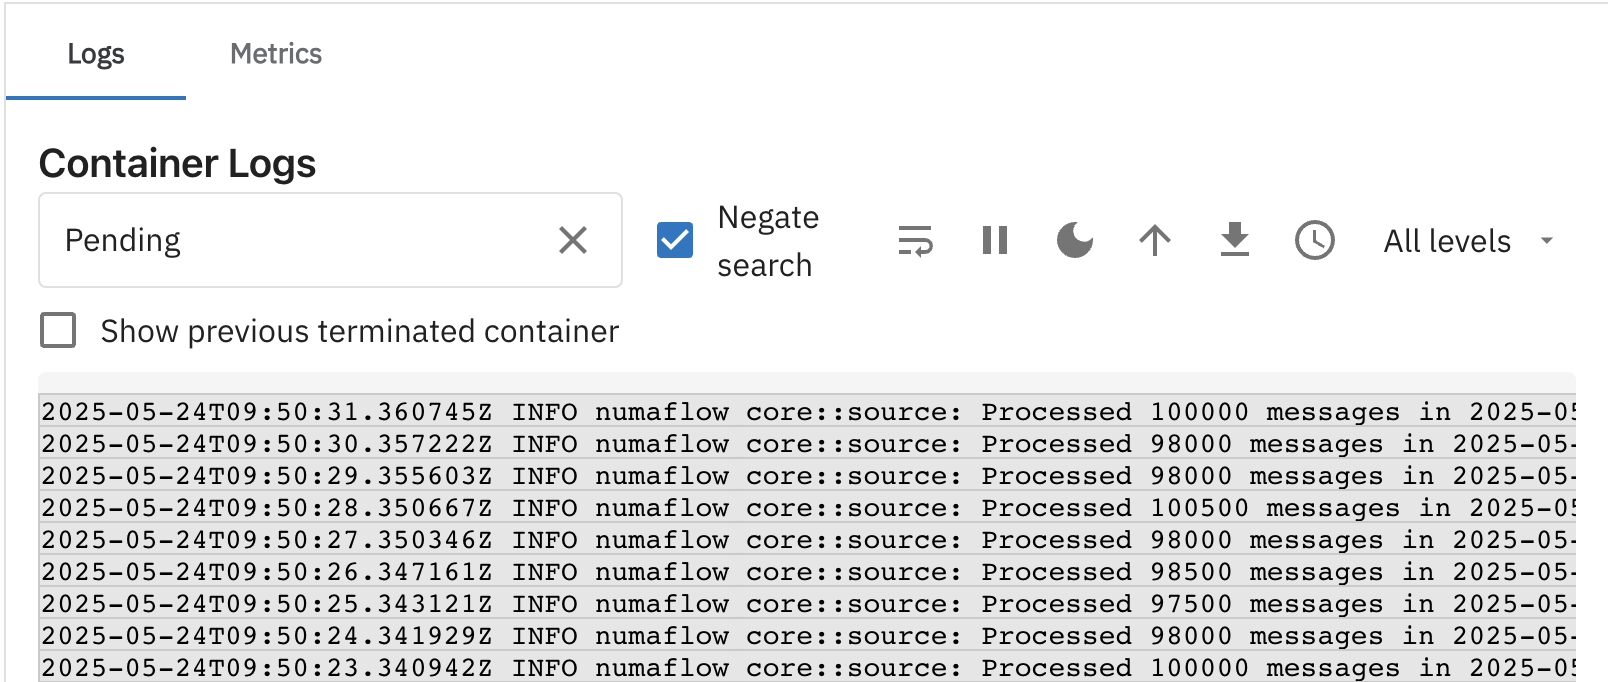
Enable Negate search to hide lines that match your search term and show only non-matching lines. Useful for filtering out noisy messages (for example, excluding lines containing pending).
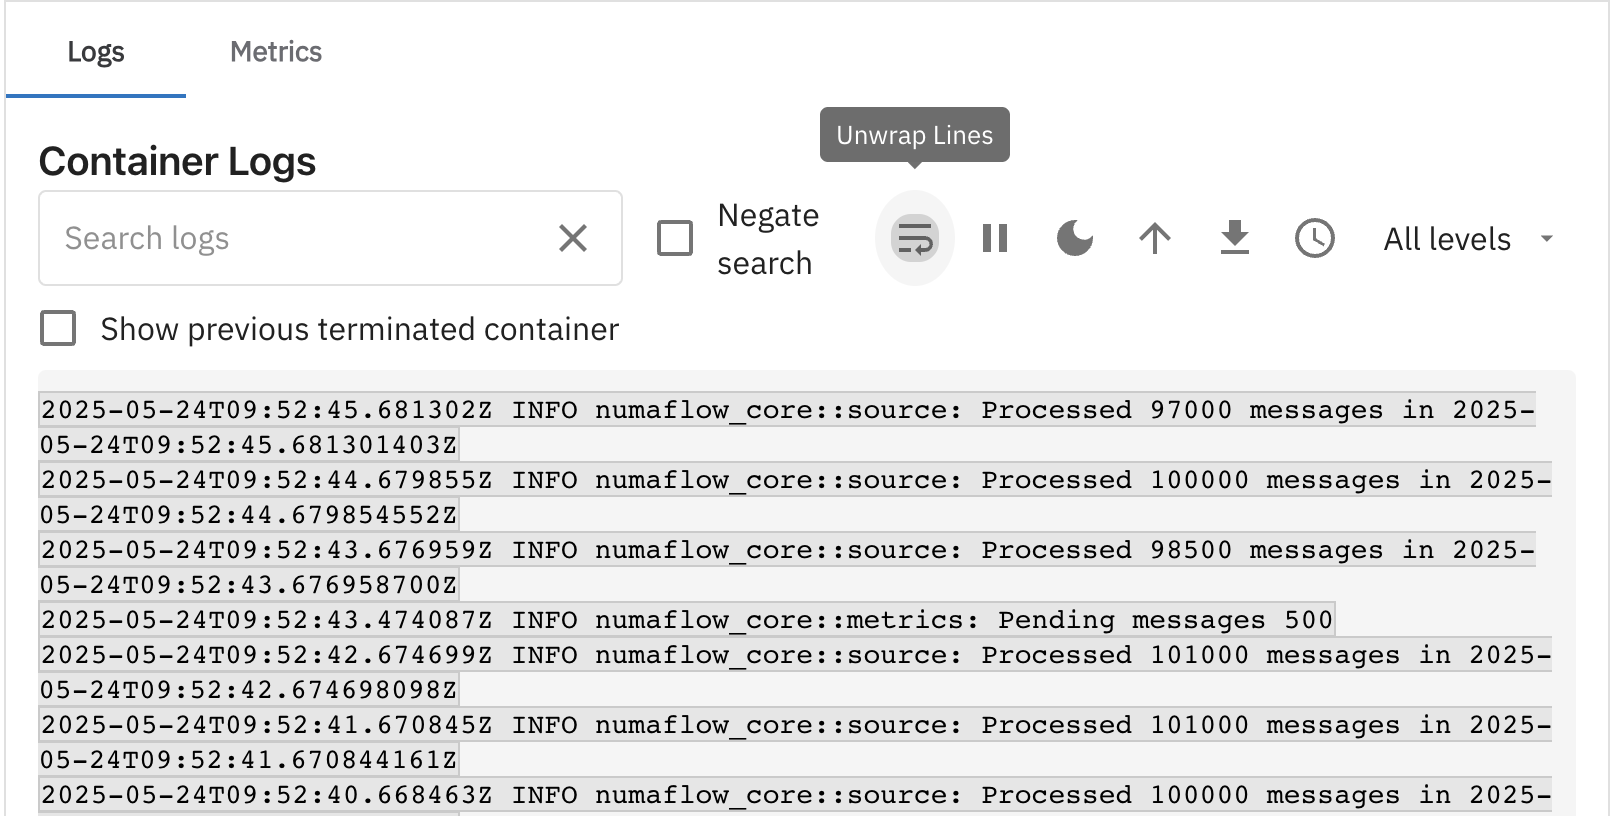
5. Wrap lines
Toggle Wrap lines to wrap long log lines instead of horizontal scrolling. Wrap is enabled by default. When wrap is off, the button shows Unwrap lines and long entries display on a single line with horizontal scrolling.
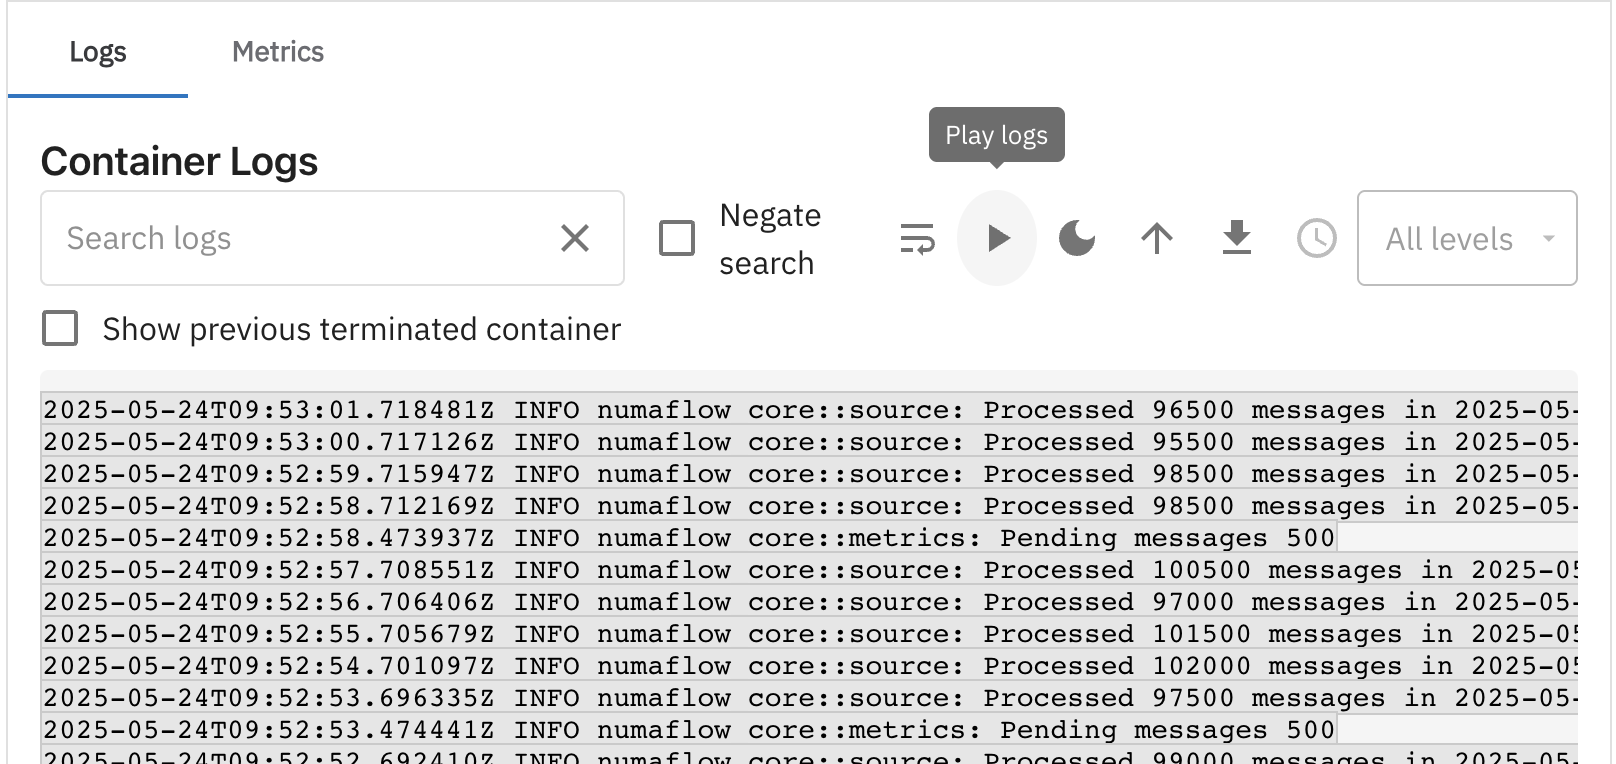
6. Pause and resume
Click Pause logs to stop new lines from appearing while you inspect what is on screen. Click Play logs to resume. Resuming resets the window to the default 1,000 lines.
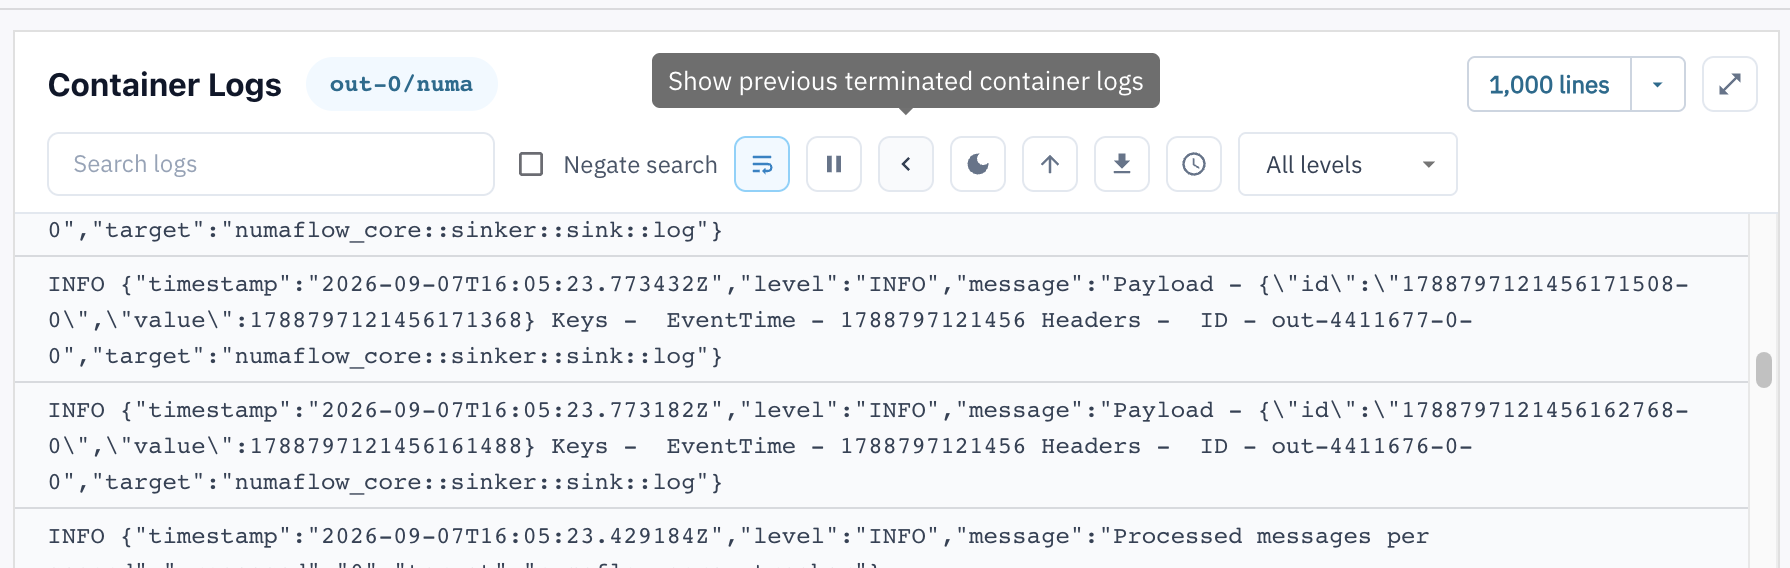
7. Previous terminated container logs
Click the back (<) toolbar button to view logs from the previous terminated container instance. This helps debug crashes and restarts.
While in this mode, a Previous container banner appears in the header. Click the button again to return to the current container's logs.
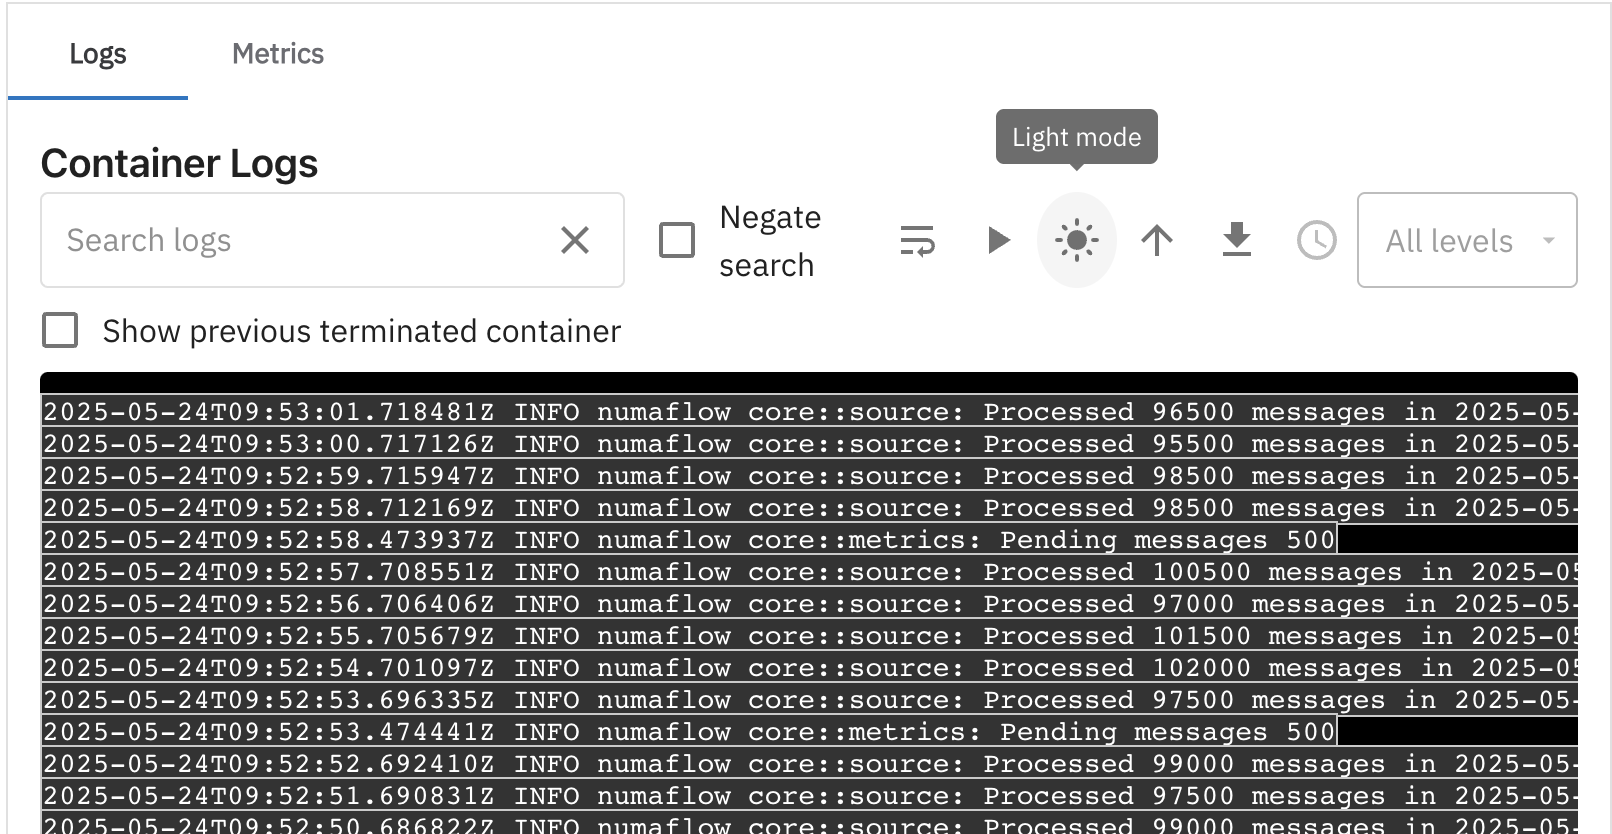
8. Dark mode
Toggle Dark mode / Light mode for readability.
9. Sort order
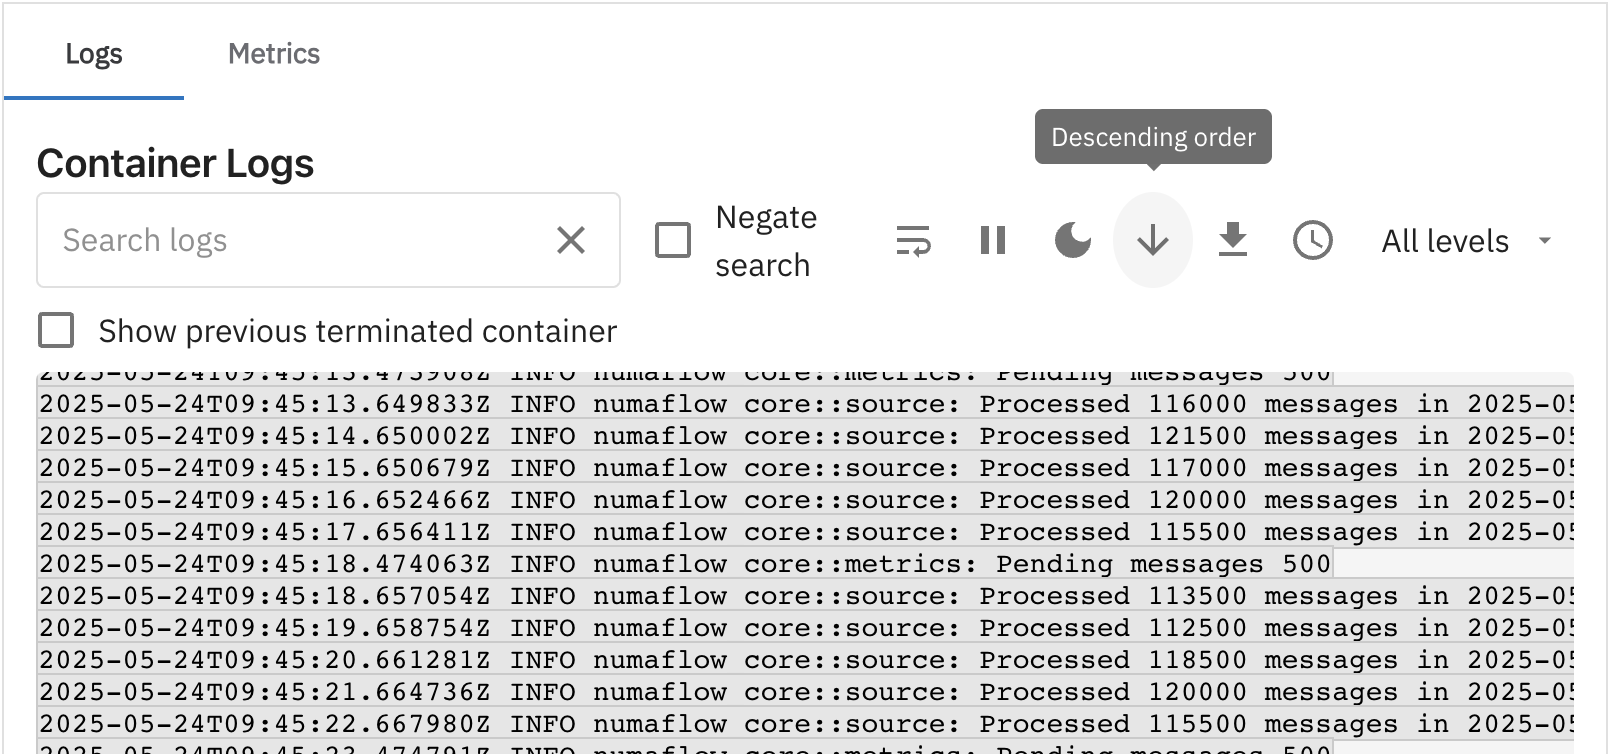
Logs default to descending order (newest first). Toggle between ascending and descending timestamp order. The active button tooltip shows the current mode (for example, Ascending order).
10. Download logs
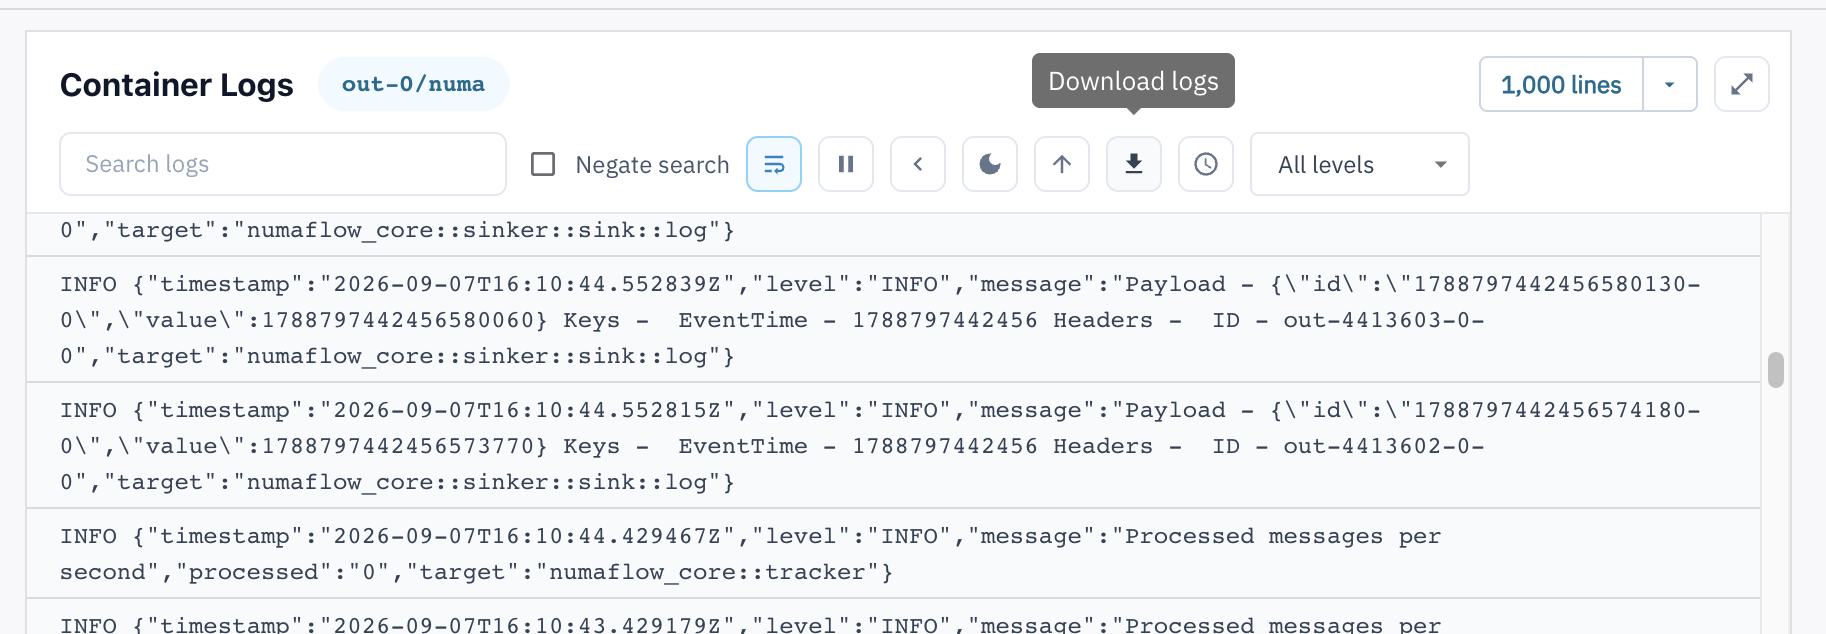
Click Download logs to save the logs as a .txt file named {podName}-{containerName}-logs.txt.
11. Timestamps
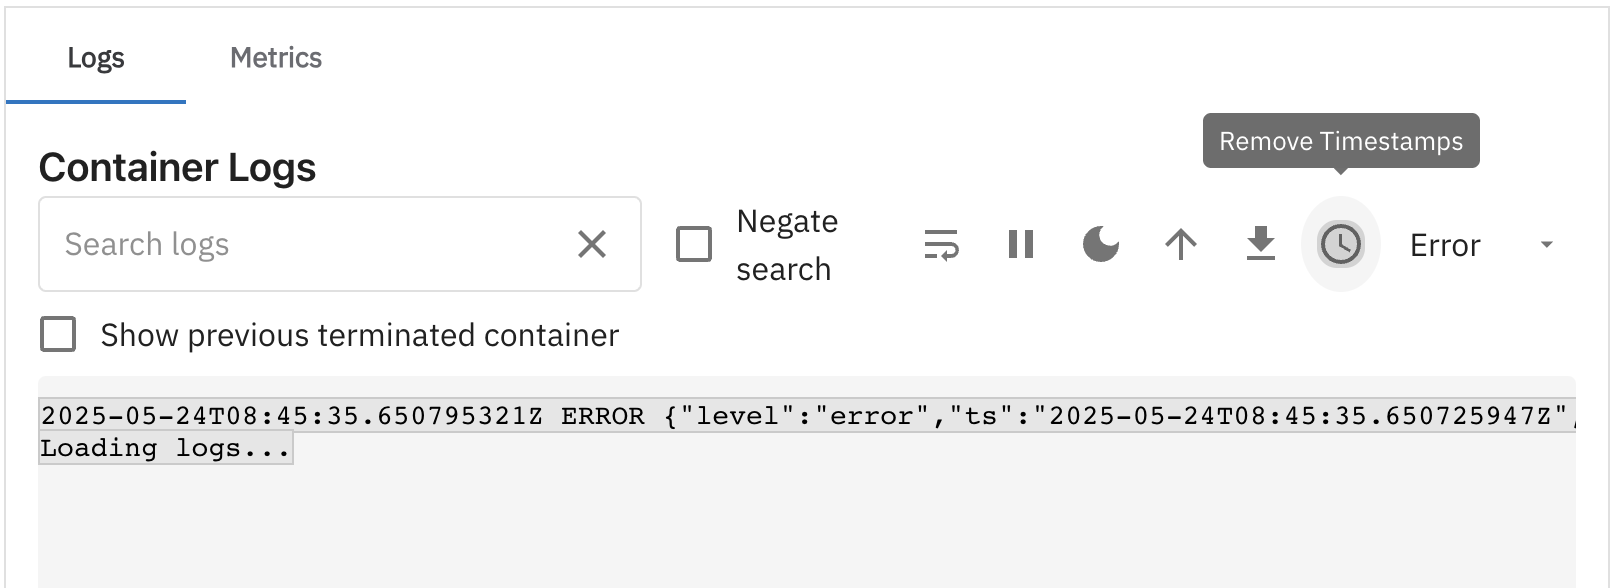
Toggle Add timestamps / Remove timestamps on log lines. This control is disabled while logs are paused.
12. Level-based filtering
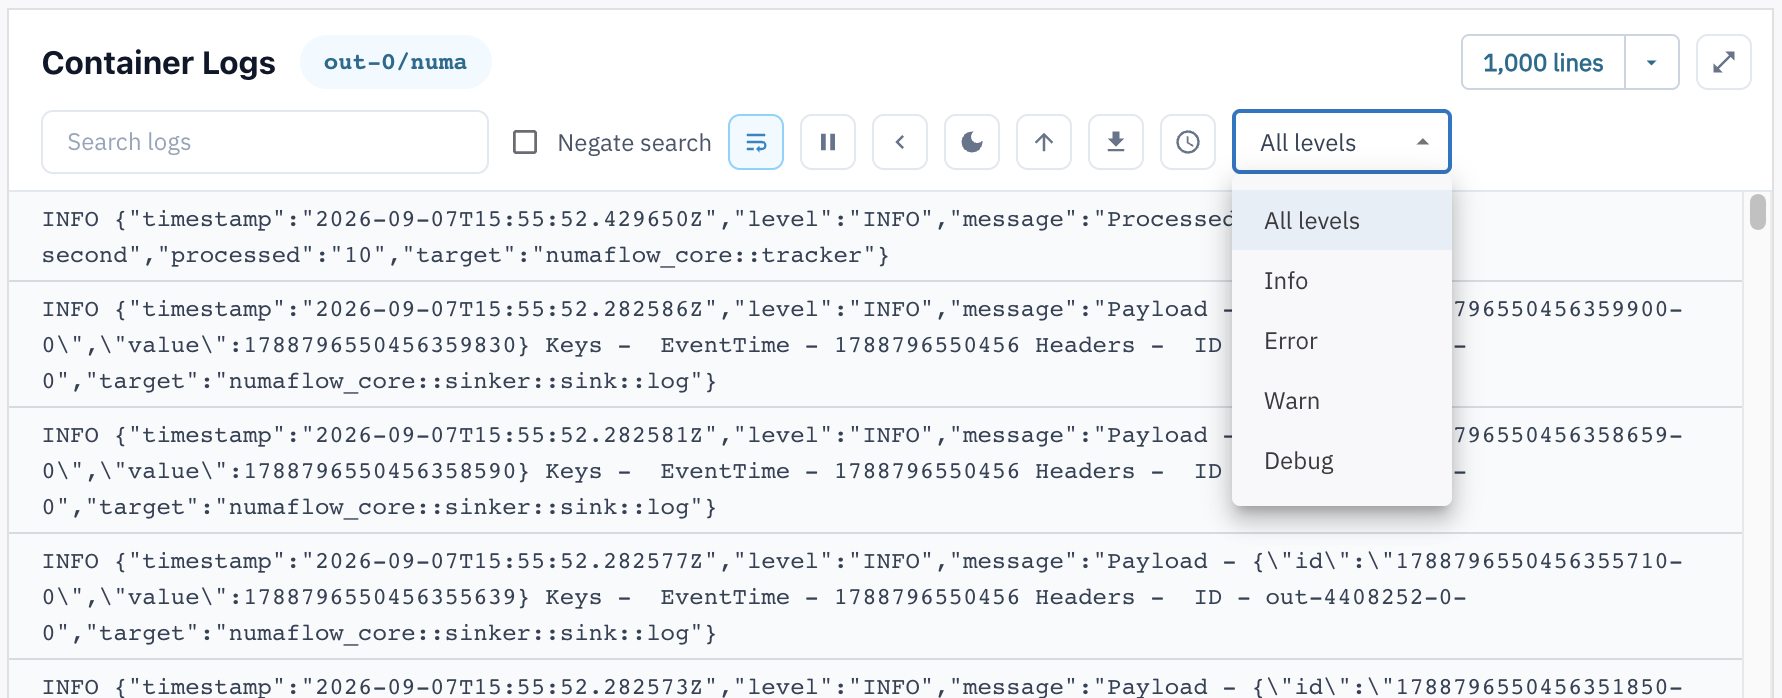
Filter by log level using the level dropdown:
- All levels
- Info
- Error
- Warn
- Debug
Level filtering is disabled while logs are paused.
Tips
- Use pause before downloading if you want a stable snapshot of what is on screen.
- Combine search and negate search to narrow down noisy output.
- For crash debugging, switch to previous terminated container logs after a restart.
- Use focus view when reviewing long JSON or stack traces.