Quick Start
This guide will walk you through the following steps:
- Installing Numaflow
- Creating and running a simple Numaflow Pipeline
- Creating and running an advanced Numaflow Pipeline
- Creating and running a Numaflow MonoVertex
Before You Begin: Prerequisites
To get started with Numaflow, ensure you have the following tools and setups ready:
Container Runtime
You need a container runtime to run container images. Choose one of the following options:
Local Kubernetes Cluster
Set up a local Kubernetes cluster using one of these tools:
Kubernetes CLI (kubectl)
Install kubectl to manage your Kubernetes cluster. Follow the official guide for installation instructions. If you're unfamiliar with kubectl, refer to the kubectl Quick Reference Page for a list of commonly used commands.
Once these prerequisites are in place, you're ready to proceed with installing and using Numaflow.
Installing Numaflow
After completing the prerequisites, follow these steps to install Numaflow and set up the Inter-Step Buffer Service, which facilitates communication between pipeline vertices:
Create a namespace for Numaflow
kubectl create ns numaflow-system
Install Numaflow components
kubectl apply -n numaflow-system -f https://raw.githubusercontent.com/numaproj/numaflow/main/config/install.yaml
Deploy the JetStream-based Inter-Step Buffer Service
kubectl apply -f https://raw.githubusercontent.com/numaproj/numaflow/main/examples/0-isbsvc-jetstream.yaml
Once these steps are complete, Numaflow will be ready for use.
Creating a Simple Pipeline
In this section, we will create a simple pipeline that includes a source vertex to generate messages, a processing vertex that echoes the messages, and a sink vertex to log the messages.
Deploy the Simple Pipeline
Run the following command to deploy the simple pipeline:
kubectl apply -f https://raw.githubusercontent.com/numaproj/numaflow/main/examples/1-simple-pipeline.yaml
Verify the Pipeline Deployment
To view the list of pipelines you have created, use the following command:
kubectl get pipeline # or "pl" as a short name
You should see an output similar to this, where AGE indicates the time elapsed since the pipeline was created:
NAME              PHASE     VERTICES   AGE   MESSAGE
simple-pipeline   Running   3          47s
Next, inspect the status of the pipeline by checking the pods. Note that the pod names in your environment may differ from the example below:
# Wait for pods to be ready
kubectl get pods

NAME                                         READY   STATUS      RESTARTS       AGE
isbsvc-default-js-0                          3/3     Running        0           4m9s
isbsvc-default-js-1                          3/3     Running        0           4m9s
isbsvc-default-js-2                          3/3     Running        0           4m9s
simple-pipeline-cat-0-xjqbe                  3/3     Running        0           99s
simple-pipeline-daemon-784d5cfd97-vpsmk      1/1     Running        0           99s
simple-pipeline-in-0-vvhu1                   2/2     Running        0           100s
simple-pipeline-out-0-y1z8e                  2/2     Running        0           99s
View Logs for the Output Vertex
To monitor the logs for the output vertex, run the following command. Replace xxxxx with the appropriate pod name from the output above:
kubectl logs -f simple-pipeline-out-0-xxxxx
You should see logs similar to the following:
2025/05/09 11:23:38 (out)  Payload -  {"Data":{"value":1746789818182898304},"Createdts":1746789818182898304}  Keys -  [key-0-0]  EventTime -  1746789818182  Headers -    ID -  cat-1526-0-0
2025/05/09 11:23:38 (out)  Payload -  {"Data":{"value":1746789818182898304},"Createdts":1746789818182898304}  Keys -  [key-0-0]  EventTime -  1746789818182  Headers -    ID -  cat-1529-0-0
2025/05/09 11:23:38 (out)  Payload -  {"Data":{"value":1746789818182898304},"Createdts":1746789818182898304}  Keys -  [key-0-0]  EventTime -  1746789818182  Headers -    ID -  cat-1528-0-0
Access the Numaflow UI
Numaflow includes a built-in user interface for monitoring pipelines. If your local Kubernetes cluster does not include a metrics server by default (e.g., Kind), install it using the following commands:
kubectl apply -f https://github.com/kubernetes-sigs/metrics-server/releases/latest/download/components.yaml
kubectl patch -n kube-system deployment metrics-server --type=json -p '[{"op":"add","path":"/spec/template/spec/containers/0/args/-","value":"--kubelet-insecure-tls"}]'
To access the UI, port-forward the Numaflow server:
kubectl -n numaflow-system port-forward deployment/numaflow-server 8443:8443
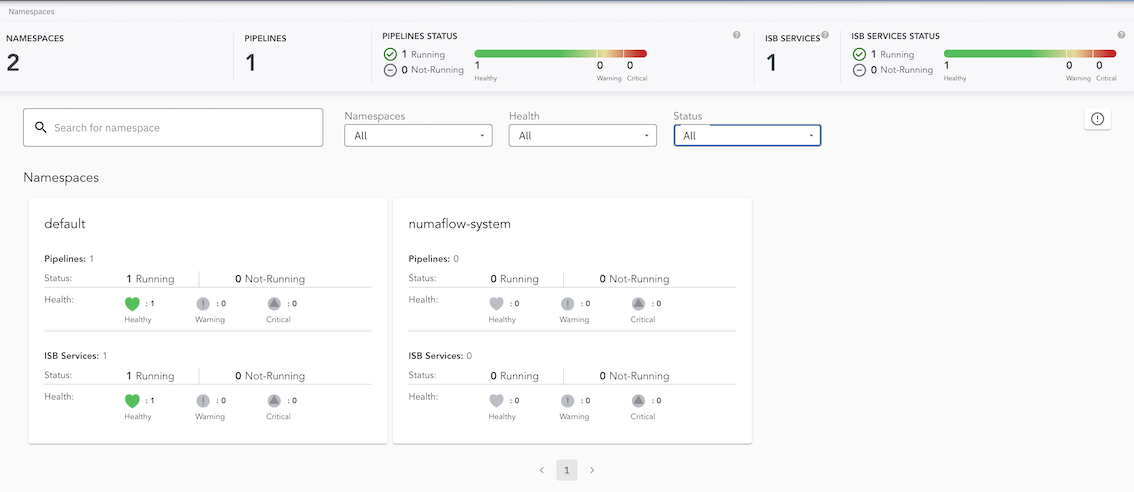
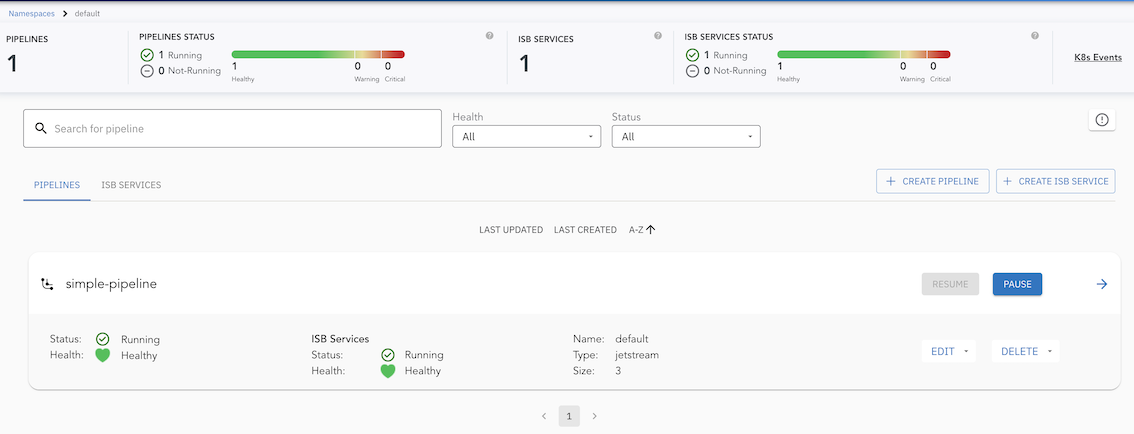
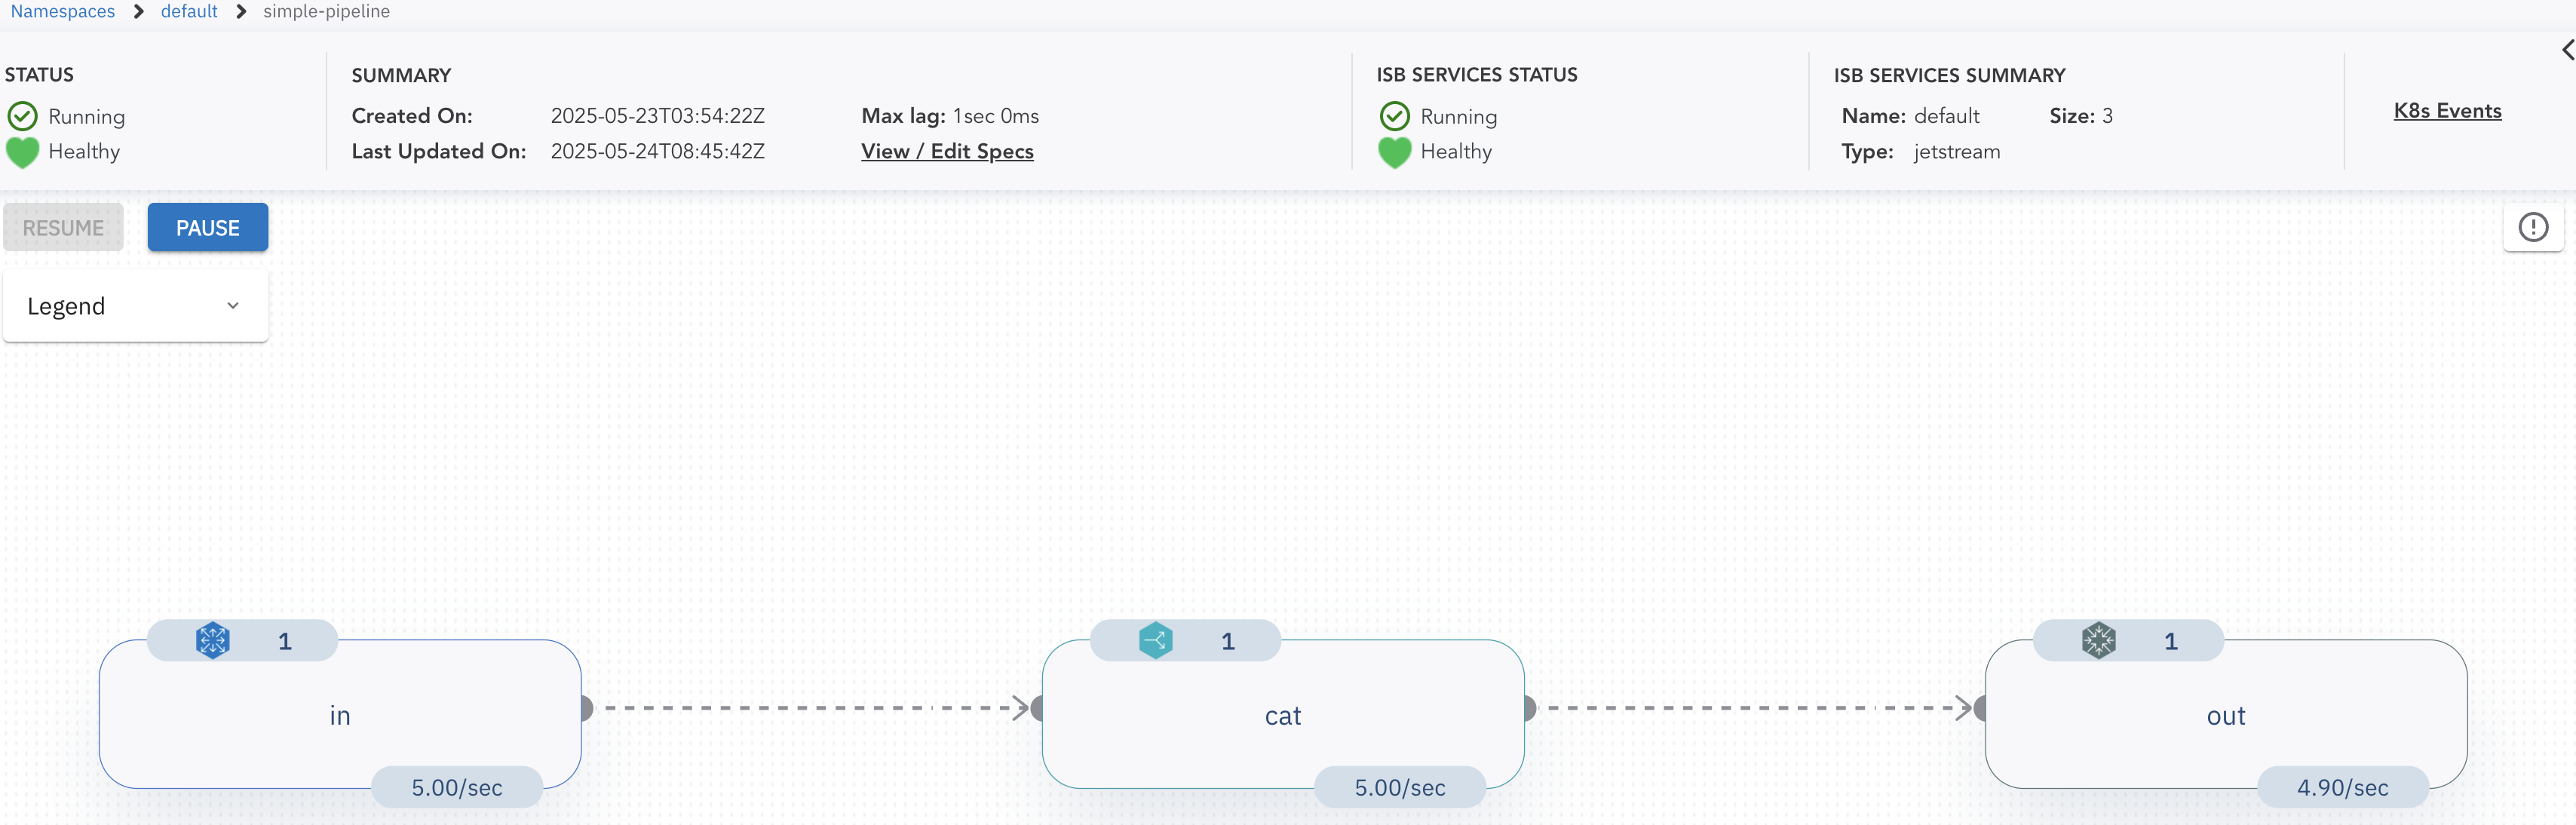
Visit https://localhost:8443/ to view the UI. Below is the UI for the simple pipeline:
Cluster View
Default Namespace View
Simple Pipeline View
Note: For more details about the UI features and built-in debugging tools, check out the UI section.
Deleting Pipeline
To delete the simple pipeline, run the following command:
kubectl delete -f https://raw.githubusercontent.com/numaproj/numaflow/main/examples/1-simple-pipeline.yaml
Creating an Advanced Pipeline
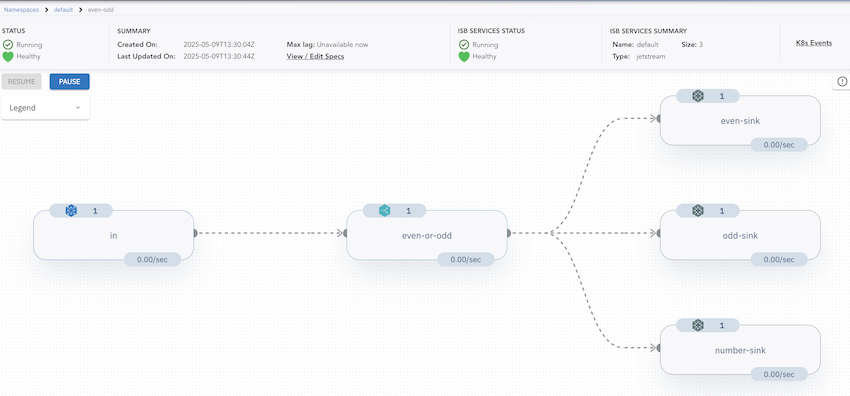
Now we will walk you through creating an advanced pipeline. In our example, this is called the even-odd pipeline, illustrated by the following diagram:
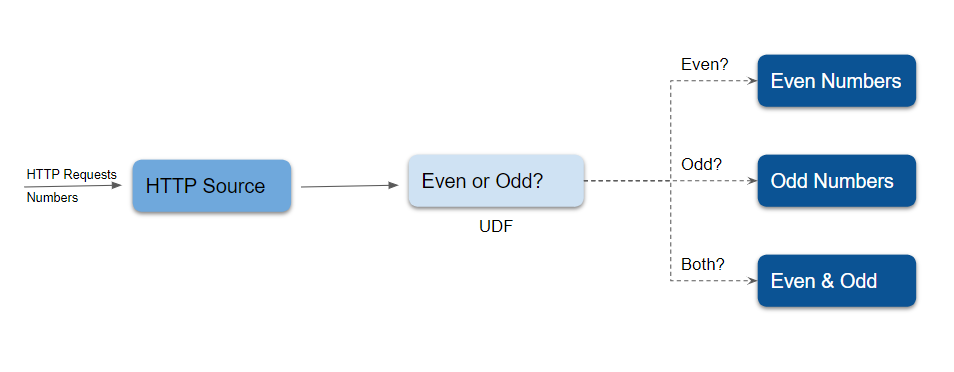
There are five vertices in this example of an advanced pipeline. An HTTP source vertex which serves an HTTP endpoint to receive numbers as source data, a UDF vertex to tag the ingested numbers with the key even or odd, three Log sinks, one to print the even numbers, one to print the odd numbers, and the other one to print both the even and odd numbers.
Deploying the even-odd Pipeline
To deploy the even-odd pipeline, run the following command:
kubectl apply -f https://raw.githubusercontent.com/numaproj/numaflow/main/examples/2-even-odd-pipeline.yaml
You can check the list of pipelines you have created so far using:
kubectl get pipeline # or "pl" as a short name
NAME       PHASE     VERTICES   AGE   MESSAGE
even-odd   Running   5          51s
Otherwise, proceed to inspect the status of the pipeline by checking the pods:
# Wait for pods to be ready
kubectl get pods

NAME                               READY   STATUS    RESTARTS   AGE
even-odd-daemon-75cdcd5f4c-nmrrp   1/1     Running   0          95s
even-odd-even-or-odd-0-i72hw       3/3     Running   0          95s
even-odd-even-sink-0-gnhou         2/2     Running   0          95s
even-odd-in-0-tvfef                2/2     Running   0          95s
even-odd-number-sink-0-3s3nc       2/2     Running   0          95s
even-odd-odd-sink-0-zktib          2/2     Running   0          95s
isbsvc-default-js-0                3/3     Running   0          15m
isbsvc-default-js-1                3/3     Running   0          15m
isbsvc-default-js-2                3/3     Running   0          15m
Sending Data to the Pipeline
Port-forward the HTTP endpoint of the source vertex and send data using curl. Replace xxxxx with the appropriate pod name:
kubectl port-forward even-odd-in-0-xxxxx 8444:8443

# Send data to the HTTP endpoint
curl -kq -X POST -d "101" https://localhost:8444/vertices/in
curl -kq -X POST -d "102" https://localhost:8444/vertices/in
curl -kq -X POST -d "103" https://localhost:8444/vertices/in
curl -kq -X POST -d "104" https://localhost:8444/vertices/in
Viewing Logs for the even and odd Vertices
Monitor the logs for the even and odd vertices to verify the pipeline's functionality. Replace xxxxx with the appropriate pod names:
# Logs for the even vertex
kubectl logs -f even-odd-even-sink-0-xxxxx

2025/05/09 13:34:26 (even-sink)  Payload -  104  Keys -  [even]  EventTime -  1746797665477  Headers -  Content-Length: 3, Content-Type: application/x-www-form-urlencoded, User-Agent: curl/8.7.1, Accept: */*,   ID -  even-or-odd-1-0-0
2025/05/09 13:34:26 (even-sink)  Payload -  102  Keys -  [even]  EventTime -  1746797665430  Headers -  Content-Type: application/x-www-form-urlencoded, User-Agent: curl/8.7.1, Accept: */*, Content-Length: 3,   ID -  even-or-odd-2-0-0

# Logs for the odd vertex
kubectl logs -f even-odd-odd-sink-0-xxxxx


2025/05/09 13:34:26 (odd-sink)  Payload -  101  Keys -  [odd]  EventTime -  1746797665407  Headers -  Content-Length: 3, Content-Type: application/x-www-form-urlencoded, User-Agent: curl/8.7.1, Accept: */*,   ID -  even-or-odd-4-0-0
2025/05/09 13:34:26 (odd-sink)  Payload -  103  Keys -  [odd]  EventTime -  1746797665452  Headers -  Content-Length: 3, Content-Type: application/x-www-form-urlencoded, User-Agent: curl/8.7.1, Accept: */*,   ID -  even-or-odd-3-0-0
Accessing the Numaflow UI
To visualize the pipeline, access the Numaflow UI at https://localhost:8443/ after port forwarding. Below is the UI for the even-odd pipeline:
Deleting the Pipeline
To delete the even-odd pipeline, run:
kubectl delete -f https://raw.githubusercontent.com/numaproj/numaflow/main/examples/2-even-odd-pipeline.yaml
Additional Notes
The source code for the even-odd user-defined function is available here. You can also replace the Log Sink with other sinks, such as Kafka, to forward data to Kafka topics.
Creating a MonoVertex
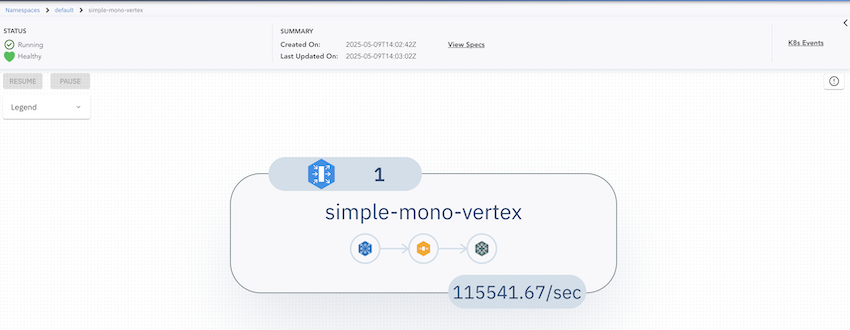
This section demonstrates how to create and deploy a simple MonoVertex that includes a User-Defined Source (UDSource), a Transformer, and a User-Defined Sink (UDSink). The sink in this example is a log sink.
Deploying the MonoVertex
To deploy the MonoVertex, run the following command:
kubectl apply -f https://raw.githubusercontent.com/numaproj/numaflow/main/examples/21-simple-mono-vertex.yaml
Verifying the Deployment
Check the list of deployed MonoVertices using:
kubectl get monovertex # or "mvtx" as a short name
You should see an output similar to this:
NAME                 PHASE     DESIRED   CURRENT   READY   AGE   REASON   MESSAGE
simple-mono-vertex   Running   1         1         1       38s
Inspect the status of the MonoVertex by listing the pods. Replace xxxxx with the appropriate pod name from your environment:
# Wait for pods to be ready
kubectl get pods

NAME                                           READY   STATUS    RESTARTS   AGE
simple-mono-vertex-mv-0-w7fmq                  5/5     Running   0          2m30s
simple-mono-vertex-mv-daemon-55bff65db5-mk4g2  1/1     Running   0          2m30s
Viewing Pod Details
To ensure all containers (monitor, udsource, transformer, udsink, and numa) are running, describe the MonoVertex pod:
kubectl describe pod simple-mono-vertex-mv-0-xxxxx
Monitoring Logs for the Sink Container
To view logs from the udsink container, use the following command. Replace xxxxx with the appropriate pod name:
kubectl logs -f simple-mono-vertex-mv-0-xxxxx -c udsink
You should see output similar to:
107705990
107705991
107705992
107705993
107705994
107705995
107705996
107705997
107705998
107705999
Accessing the Numaflow UI
To visualize the MonoVertex, access the Numaflow UI by port-forwarding the Numaflow server:
kubectl -n numaflow-system port-forward deployment/numaflow-server 8443:8443
Visit https://localhost:8443/ to view the UI. Below is an example of the UI for the MonoVertex:
For more details about the UI features and debugging tools, refer to the UI section.(TODO: add UI section link)
Deleting the MonoVertex
To delete the MonoVertex, run:
kubectl delete -f https://raw.githubusercontent.com/numaproj/numaflow/main/examples/21-simple-mono-vertex.yaml
Additional Notes
The source code for the user-defined functions used in this MonoVertex is available here:
A pipeline with reduce (aggregation)
To set up an example pipeline with the Reduce UDF, see Reduce Examples.
What's Next
Try more examples in the examples directory.
After exploring how Numaflow pipelines run, you can check what data Sources and Sinks Numaflow supports out of the box, or learn how to write User-defined Functions.
Numaflow can also be paired with Numalogic, a collection of ML models and algorithms for real-time data analytics and AIOps including anomaly detection. Visit the Numalogic homepage for more information.